

Process Graph
How ProcessMind shows your mined process: read the discovered flow, replay it with animation, and use the element and connection menus.
Process animation brings your data to life by showing how cases move through your process over time. By watching the flow, you can immediately identify where processes slow down, accumulate, or deviate.
Animation visualizes each case as a dot traveling through your process diagram. The dots move according to real timestamps in your data, showing you:
It’s like watching a time-lapse of your entire process.
The animation controls are in the bottom bar of the dashboard:
| Control | Action | Button |
|---|---|---|
| Play | Start the animation | Play button |
| Pause | Pause at current point | Pause button |
| Timeline | Drag to jump to specific time |
The timeline shows the date range of your data. As the animation plays, a marker moves along the timeline showing the current point in time.
Customize the animation using the Speed menu in the bottom bar:
Adjust how fast the animation runs by selecting a speed multiplier:
| Speed | Use Case |
|---|---|
| 0.1x | Very slow - examine individual case movements in detail |
| 0.2x | Slow - detailed analysis of flow patterns |
| 0.5x | Moderate - balance between detail and overview |
| 1x | Normal speed - default playback |
| 2x | Fast - quick overview of patterns |
| 5x | Very fast - rapid scanning of long time periods |
| 10x | Maximum speed - fastest overview |
Use faster speeds for initial exploration, then slow down when you spot something interesting.
When enabled, each dot leaves a trail showing its recent path. This makes it easier to:
When enabled, all cases begin animating from the start simultaneously rather than appearing at their actual timestamps. This is useful for comparing case paths without time-based distribution. This mode emphasizes path variations and bottlenecks without the influence of timing. If you want to identify the fastest or slowest cases, they will be visually apparent as they move through the process at the same time but with different speeds.
Performance Tip
For large datasets, disable Show tails if the animation feels sluggish. This reduces visual complexity and improves performance.
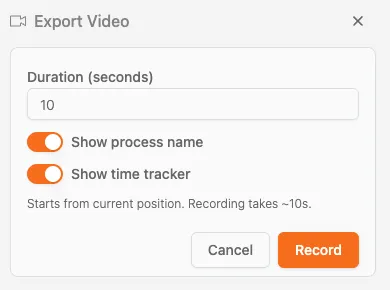
You can export the animation as a video for presentations or reports. Select Export Video from the Speed menu to open the export dialog.
| Option | Description |
|---|---|
| Duration (seconds) | Set how long the video recording should be (for example, 10 seconds) |
| Show process name | Toggle to display the process name in the video |
| Show time tracker | Toggle to display the current timestamp during playback |
Video Format
Videos are exported in WebM format, a modern, open video format optimized for the web. WebM is an open-source, royalty-free, and highly efficient video file format sponsored by Google, designed specifically for web streaming. .
Recording Time
The recording process takes roughly the same time as the duration you set. A 10-second video takes approximately 10 seconds to record.
For static presentations:
The animated dots representing cases are interactive. You can click or hover on any dot to view details about that specific case.
When you click or hover on a dot, a tooltip appears showing the Case ID of that case.
This is extremely useful when you notice:
Pause for Precision
It’s recommended to pause the animation when you want to click on a specific case. This makes it much easier to target and select the dot you’re interested in, especially in busy areas of the process.
When dots pile up at a specific activity, that’s a bottleneck. Cases are arriving faster than they can be processed.
What it looks like: A growing cluster of dots at one activity while other parts of the process are empty.
When dots travel backwards through the process, that indicates rework: cases returning to earlier steps.
What it looks like: Dots moving against the main flow direction, especially with Show tails enabled.
Notice when cases move quickly versus slowly:
Different cases may take different routes through your process. Animation makes this visible:
Start fast, then slow down: Use high speed to get an overview, then slow down when you spot patterns
Use with filters: Filter to specific case types or time periods before animating to focus your analysis
Pause and investigate: When you see something interesting, pause and click on the accumulated cases to investigate further
Compare time periods: Animate each period in turn to see how the flow changed between them
Show stakeholders: Animation is effective for communicating findings to non-technical audiences
We use cookies to improve your experience, personalize content, and analyze traffic. By clicking "Accept All," you consent to our use of cookies.