Analyzing Processes in ProcessMind
Learn how to explore, filter, and understand your process data using ProcessMind dashboards. A guide for dashboard viewers and analysts.
Filters let you focus on specific subsets of your data. Instead of analyzing everything at once, you can narrow down to the cases, time periods, or patterns that matter most.
Filters help you answer specific questions:
Without filters, you’re looking at averages and totals. With filters, you can isolate and compare specific segments.
The filter panel is on the left side of the dashboard.
| Control | Action |
|---|---|
| + Add Filter | Open filter menu to add a new filter |
| Active Filters | List of currently applied filters |
| X on filter | Remove that specific filter |
| Clear All | Remove all filters at once |
| Eye Icon | Temporarily disable filters without removing them |
There are three ways to add filters:
Quick Filter
Double-clicking on chart data or process elements is the fastest way to create filters based on what you’re looking at.
ProcessMind organizes filters into categories:
These filters work across all processes:
Filter by how common a process path is.
Filter based on the sequence of activities.
| Option | Meaning |
|---|---|
| Directly Followed By | Activity B immediately follows Activity A |
| Indirectly Followed By | Activity B happens at any point after Activity A |
| Not Directly Followed By | Activity B does not immediately follow A (but may happen later) |
| Never Followed By | Activity B never happens after Activity A |
Use case: Find cases where approval didn’t happen before shipping, or identify rework loops.
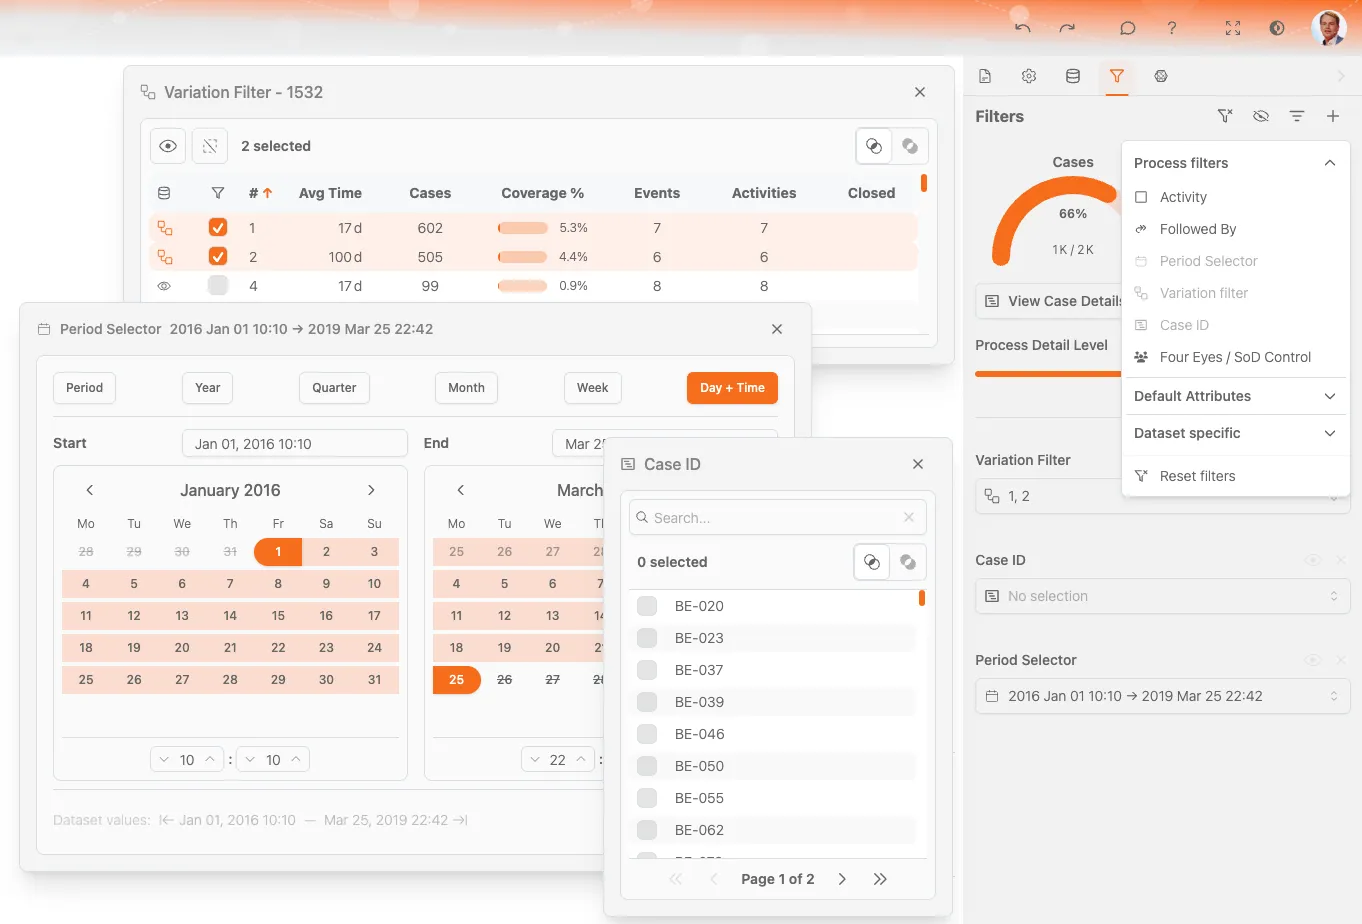
Filter by time range.
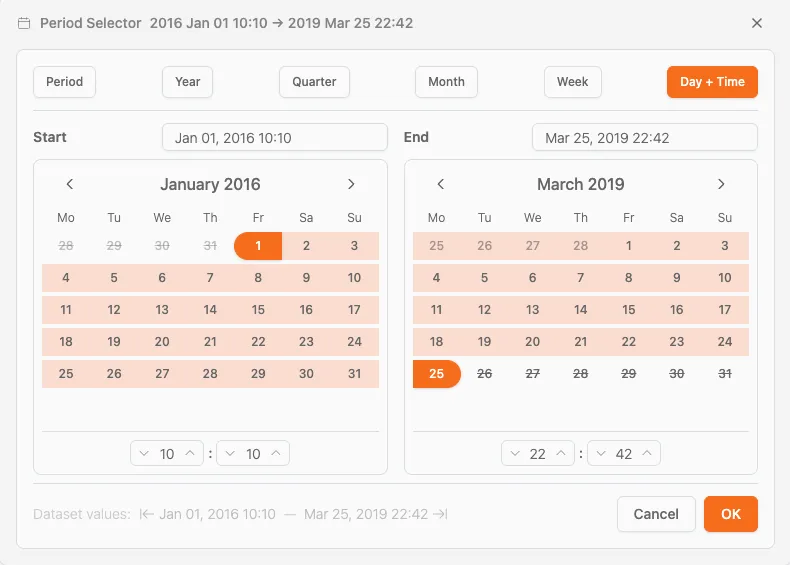
| Option | Description |
|---|---|
| Custom Period | Select specific start and end dates |
| Year | All data from a specific year |
| Quarter | Data from specific quarters |
| Month | Data from specific months |
| Week | Data from specific weeks |
| Day + Time | Precise date and time range |
Use case: Compare this quarter to last quarter, or focus on a specific incident period.
Filter by process path (variant).
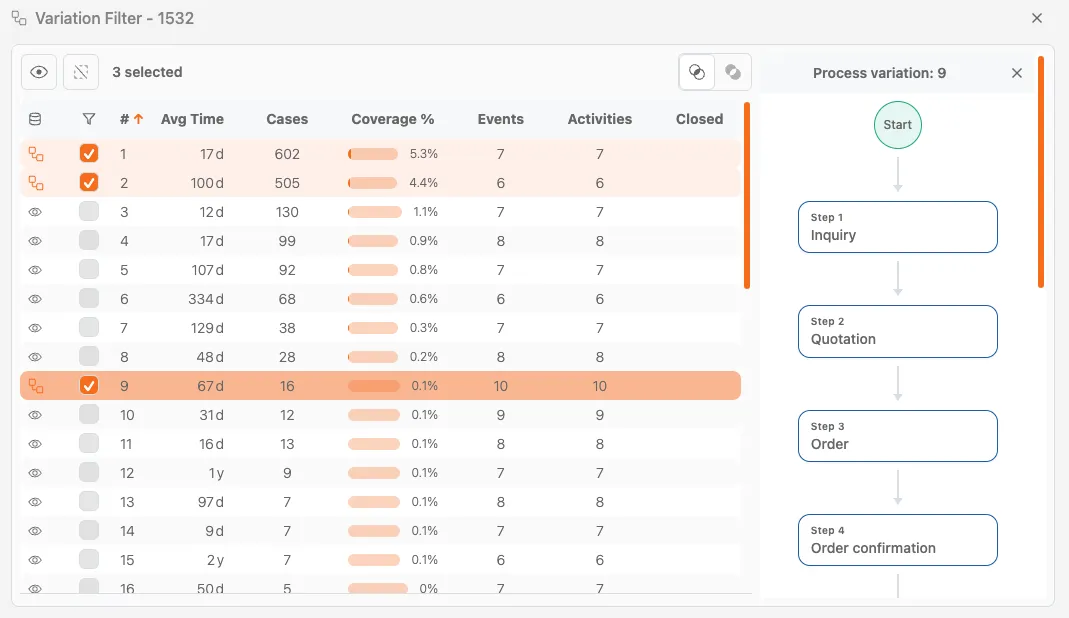
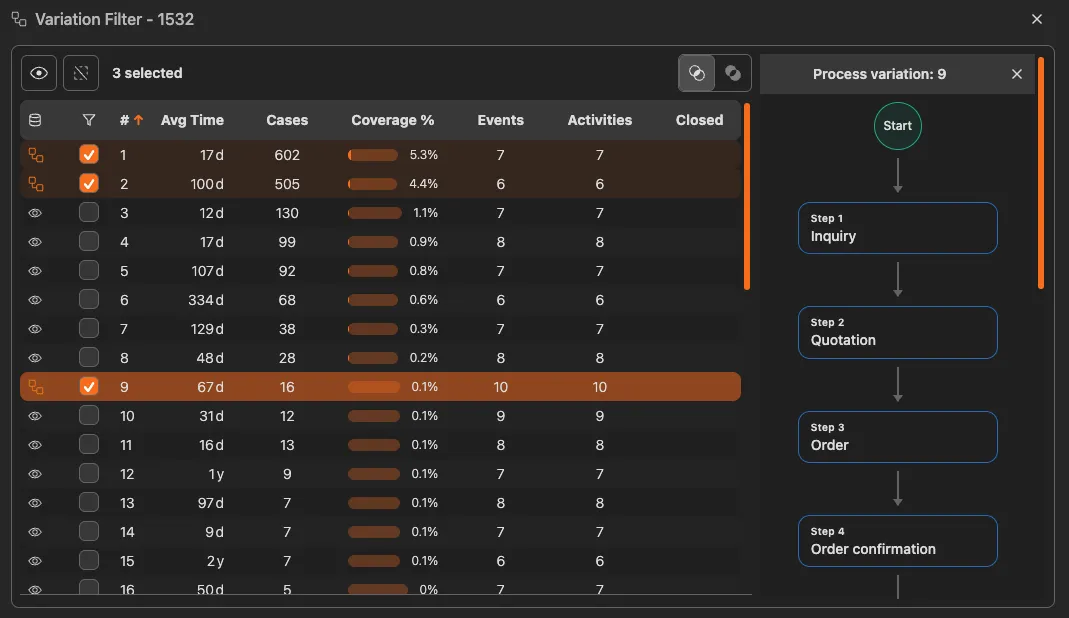
Use case: Compare the “happy path” against problematic variations.
Standard process mining metrics available on all datasets:
Filters based on attributes in your specific data:
These vary depending on what data was uploaded.
All active filters appear in the filter panel. Each filter shows:
Click the Eye Icon to disable all filters without removing them. This lets you:
Click the eye icon again to re-enable filters.
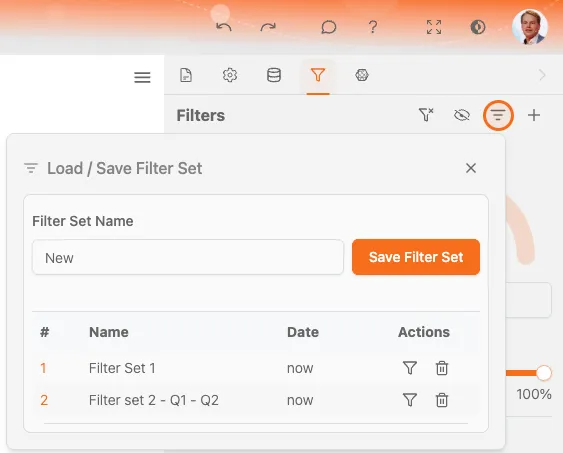
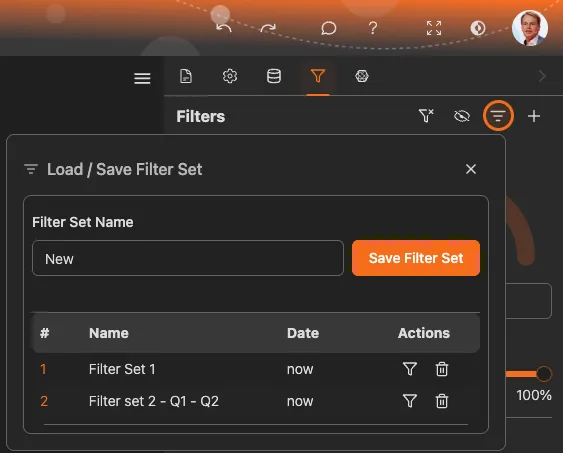
You can save a combination of filters to reuse later.
Bookmarks Include Filters
For a more complete saved state, use Bookmarks which save filters along with view settings, zoom level, and chart configurations.
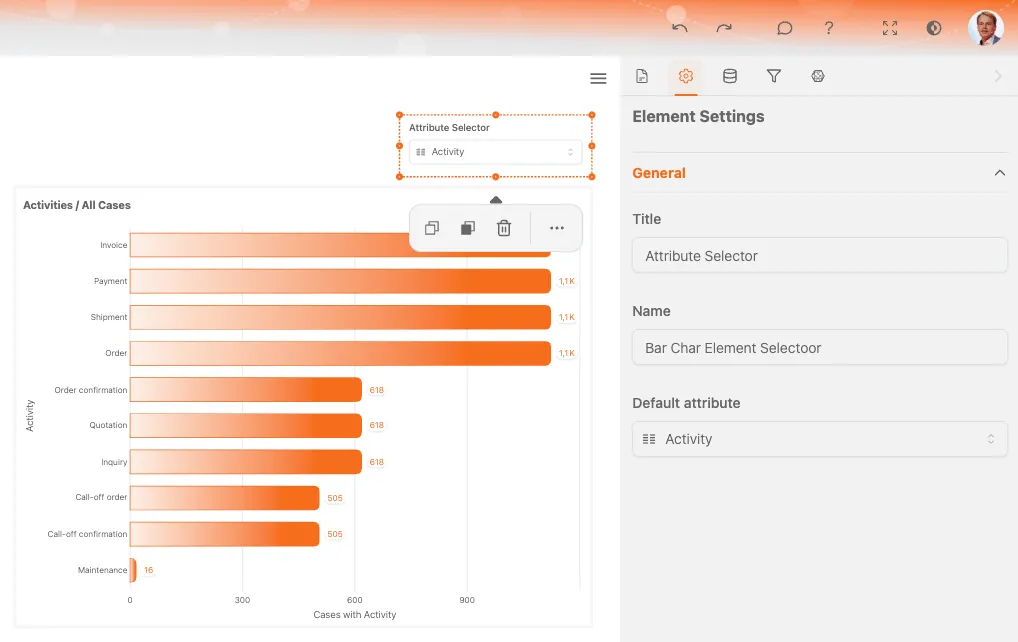
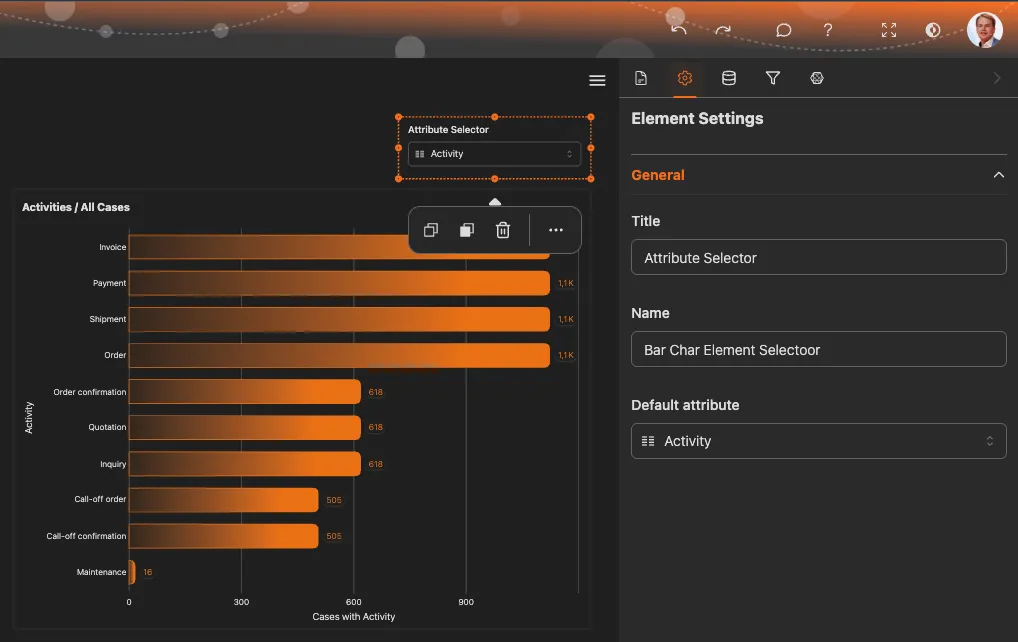
Selectors look similar to filters but serve a different purpose: instead of filtering out data, they let you choose which dimension to analyze by.
| Filters | Selectors | |
|---|---|---|
| Purpose | Exclude data | Choose perspective |
| Effect | Reduces case count | Changes grouping/breakdown |
| Example | ”Show only Europe" | "Break down by region” |
| Result | Fewer cases | Same cases, different view |
Selectors change how data is grouped and displayed in charts and metrics:
The available selectors depend on the dimensions configured in your dataset.
Selectors and filters work together:
Example: Filter to Q4 data, then use the region selector to compare regions within Q4.
Exploring Dimensions
Try different selector values to discover patterns. You might find that performance varies significantly by region, product, or customer type.
Multiple filters work together with AND logic. A case must match all active filters to be included.
Example: Period filter (January) + Region filter (Europe) = European cases from January only.
You can add filters in any order. The result is the same regardless of which filter you add first.
As you add filters, the case count decreases. If you filter too aggressively, you may end up with too few cases for meaningful analysis.
Check the case count indicator to see how many cases match your current filters.
Begin with minimal filters to understand the full picture, then progressively add filters to focus on specific questions.
We use cookies to enhance your browsing experience, serve personalized content, and analyze our traffic. By clicking "Accept All", you consent to our use of cookies.