Analyzing Processes in ProcessMind
Learn how to explore, filter, and understand your process data using ProcessMind dashboards. A guide for dashboard viewers and analysts.
The Case Explorer lets you inspect individual cases in detail. While dashboards and process maps show aggregates and patterns, the Case Explorer zooms in on a single case to show exactly what happened, when it happened, and what data is associated with each step.
Use the Case Explorer when you want to move from patterns to proof:
Analysis Best Practice
Use dashboards to spot signals, then switch to the Case Explorer to understand the underlying cases.
Click Case Explorer in the right sidebar.
A list of available cases appears on the left. Selecting a case opens the case detail view.
The case detail panel updates immediately when a different case is selected.
The case detail view is organized into four tabs:
Each tab shows a different perspective on the same case.
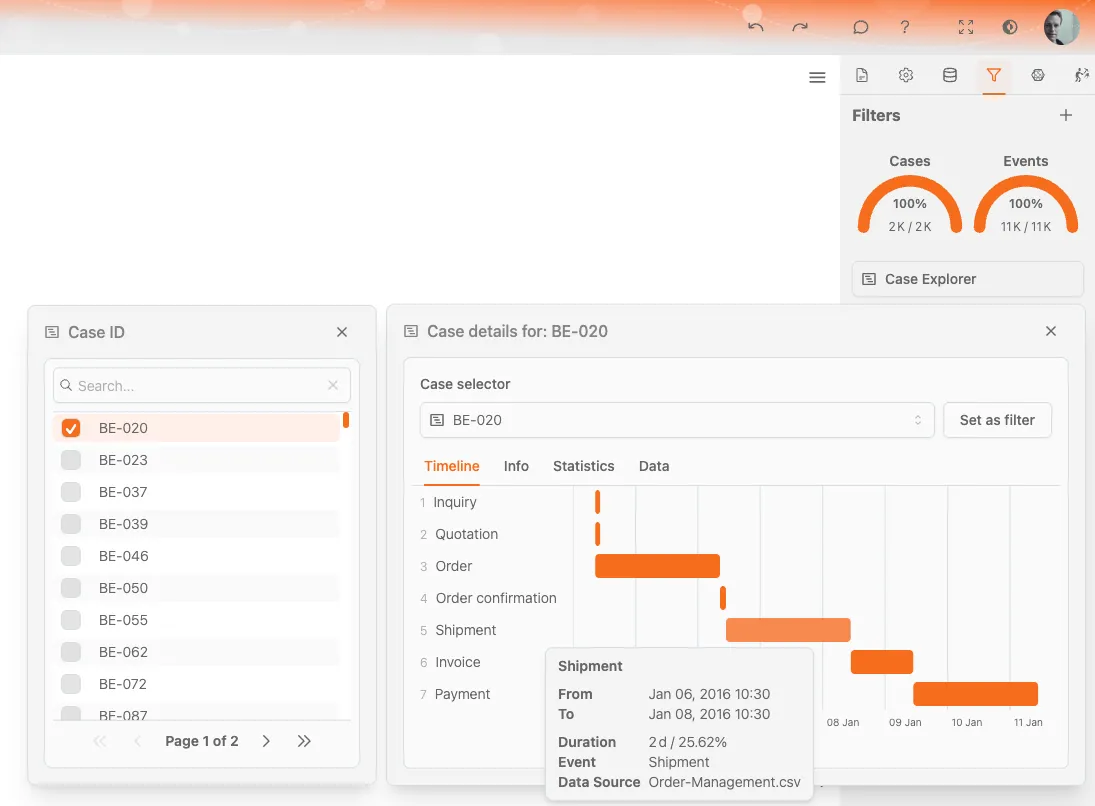
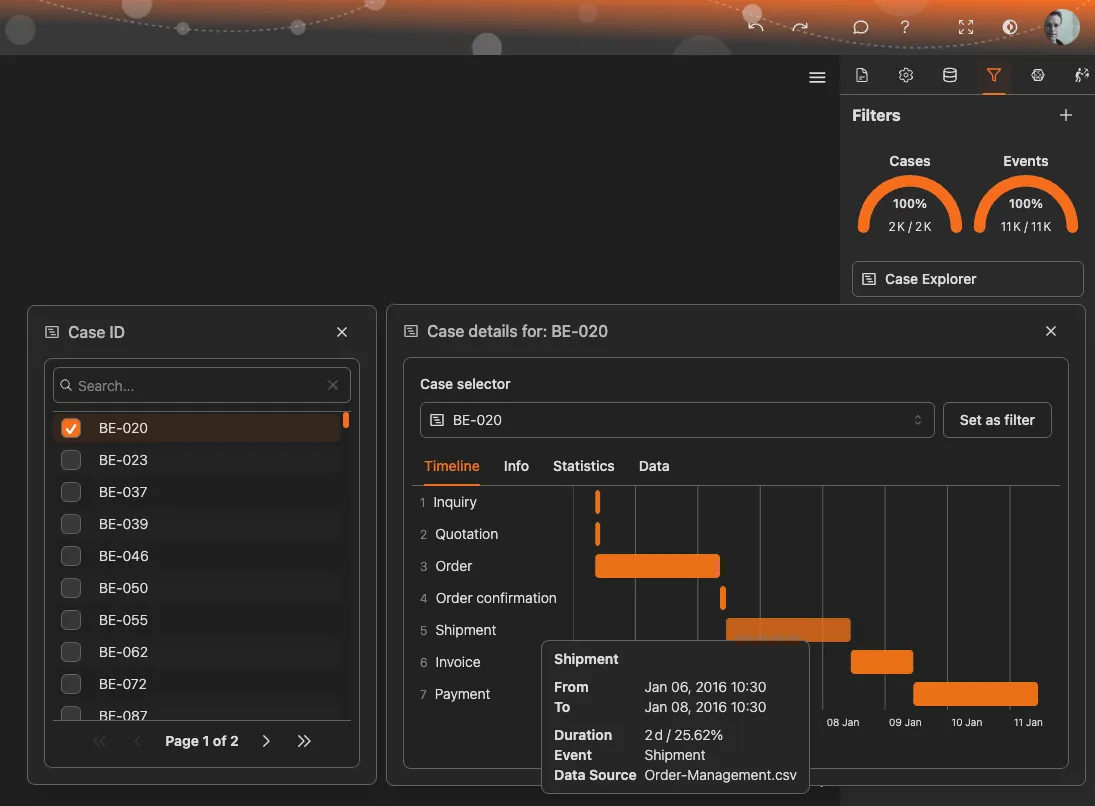
The Timeline tab shows the chronological flow of activities for the selected case.
This view makes it easy to spot delays, waiting times, and long-running steps.
The Info tab shows high-level metrics for the selected case, such as:
This tab provides a compact summary of the case at a glance.
The Statistics tab shows statistical summaries for numeric event or case attributes.
For each field, statistics may include:
This is useful for understanding variation within a single case, for example cost fluctuations across activities.
The Data tab shows the raw event-level data for the selected case in tabular form.
Each row represents one event and typically includes:
This view is ideal for precise inspection, validation, and exporting insights.
Privacy Note
Case details may include sensitive information. Visibility depends on your organization’s data and access permissions.
We use cookies to enhance your browsing experience, serve personalized content, and analyze our traffic. By clicking "Accept All", you consent to our use of cookies.