Analyzing Processes in ProcessMind
Learn how to explore, filter, and understand your process data using ProcessMind dashboards. A guide for dashboard viewers and analysts.
This quick reference helps you find your way around ProcessMind. Use it as a cheat sheet when exploring dashboards.
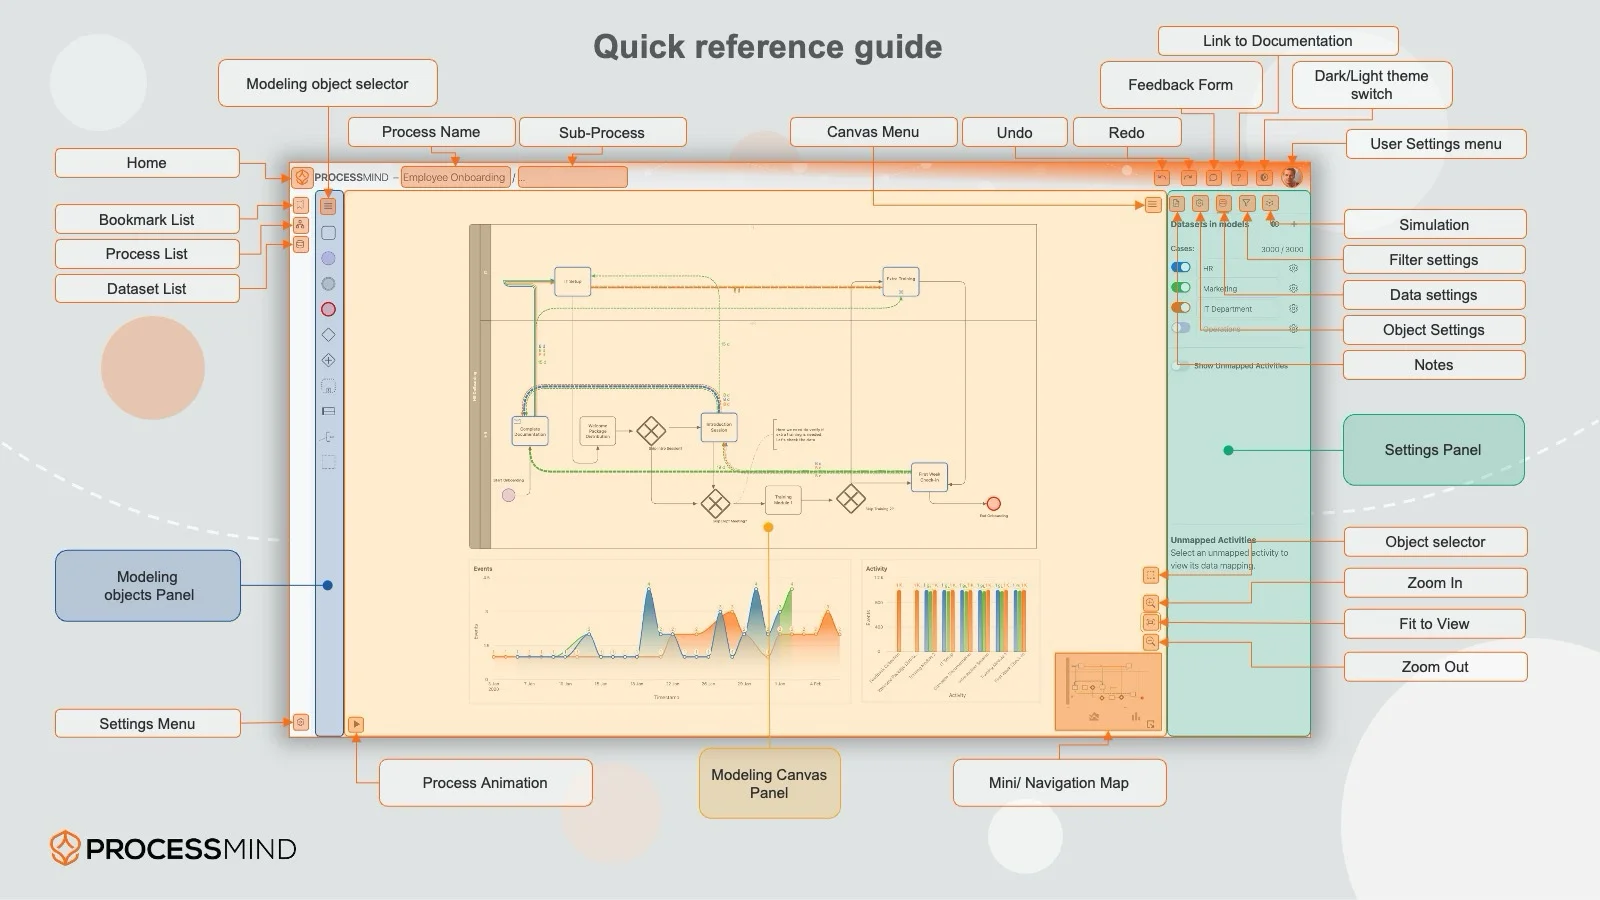
The left sidebar gives you access to:
| Feature | Description |
|---|---|
| Bookmarks | Saved dashboard views |
| Process List | All processes you have access to |
| Datasets | Available data sources |
| Settings | Personal preferences |
Click any icon to expand that panel.
The central area displays your process diagram and charts. This is where you’ll spend most of your time analyzing.
Process graph elements:
Key interactions:
The right panel shows details and options based on your selection:
The bottom bar contains:
| Button | Action |
|---|---|
| Fit | Fit entire process to screen |
| Zoom +/- | Zoom in or out |
| Fullscreen | Expand to full screen |
| Minimap | Toggle overview minimap |
| Detail Slider | Adjust process diagram complexity |
Selectors let you choose which dimension to analyze by (e.g., region, product, or team). Unlike filters, they don’t remove data. Instead, they change how it’s grouped.
| Action | How |
|---|---|
| Select element | Click on it |
| Multi-select | Hold Shift and click |
| Filter from selection | Double-click or use context menu |
| Reset view | Click Fit button |
| Open case details | Click case in Case Explorer |
| Shortcut | Action |
|---|---|
Space | Play/pause animation |
+ / - | Zoom in/out |
0 | Fit to view |
Esc | Clear selection |
F | Toggle fullscreen |
| Task | Where to Go |
|---|---|
| See how cases flow through the process | Process Animation |
| Focus on specific data | Using Filters |
| Investigate a specific case | Case Explorer |
| Save my current view | Bookmarks |
| Understand an activity’s metrics | Element Menus |
Pro Tip
Use bookmarks to save views you return to frequently. This saves time and ensures consistency across your analysis sessions.
We use cookies to enhance your browsing experience, serve personalized content, and analyze our traffic. By clicking "Accept All", you consent to our use of cookies.