Improve Business Efficiency with Process Dashboards
Explore ProcessMind dashboards—customize, analyze, and visualize your process data for actionable business insights.
ProcessMind lets you apply filters to processes and metadata, so you can focus on the data that matters most. Filtering helps you break down your data for more detailed insights and analysis.
You can add filters in three ways:
Select Data from Charts:
Select data directly in a chart and click the Filter button in the top-right corner to apply the filter. You can also double-click a selection to auto-create the filter.
Manually Add Filters:
Click the + sign in the Filter tab to add filters manually. This opens a menu with filter categories.
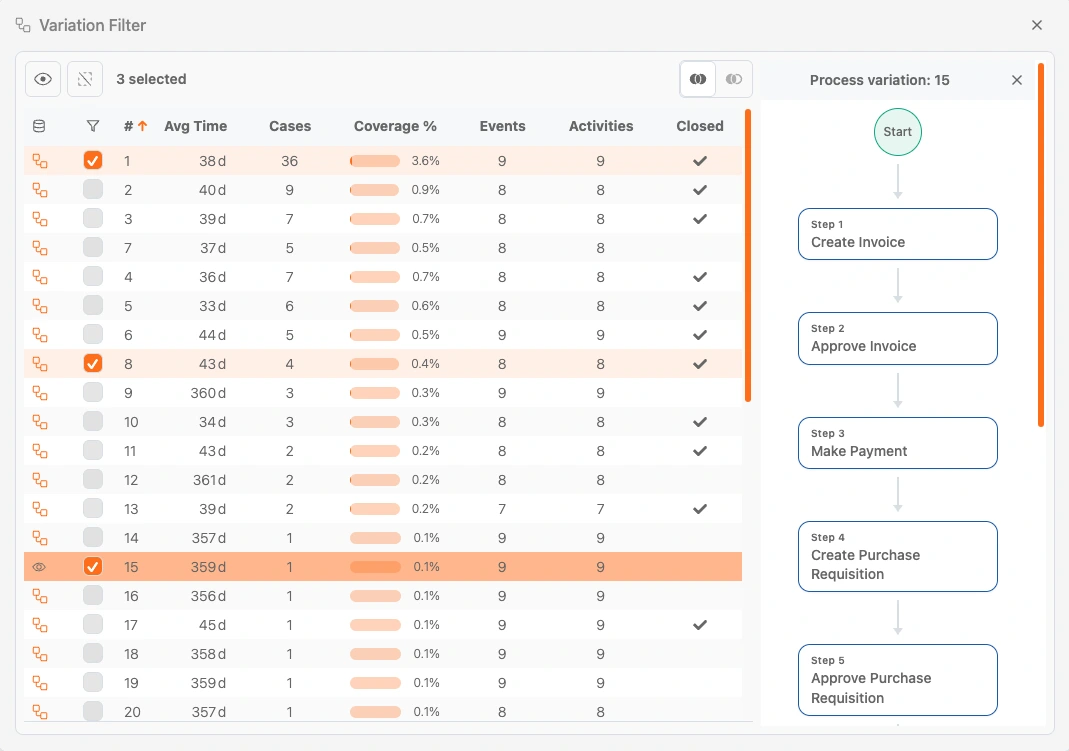
From the Process Model:
Select an activity or connection in the process model and click Filter to see available filters for that object.
ProcessMind makes it easy to manage filters. You can remove them one by one or all at once:
Removing Individual Filters:
To remove a specific filter, click the X button next to the filter in the Filter tab. This allows you to selectively clear filters while keeping others intact.
Removing All Filters:
To remove all active filters at once, click the Remove All Filters icon located at the top of the Filter tab. This clears all filters and resets your process view to its default state.
These options make it easy to manage and adjust filters as needed during your analysis.
You can temporarily disable a filter without losing its settings by clicking the eye icon above the filter panel.
This is helpful when you want to:
The filter remains in place but will not affect the view while disabled.
You can save a filter set to reuse it later, even across different datasets or processes.
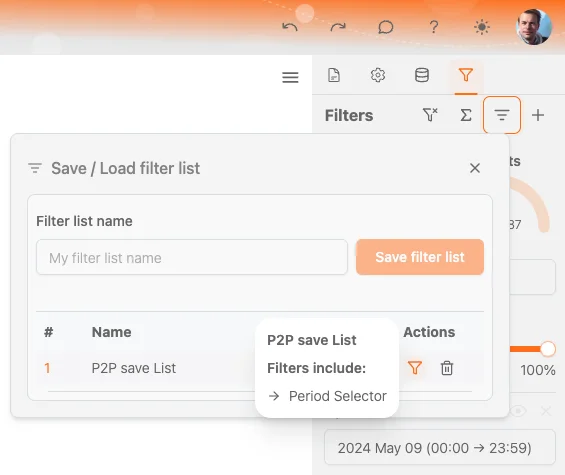
How to use:
Saved filter sets will appear in the panel. From here, you can:
This helps maintain consistency and saves time when switching between analyses.
Filter and settings stored in Bookmarks
We can use Bookmarks to save all settings in the dashboard, including all filters and filter values. This can be useful when you want to save a specific view of the process with certain filters applied.
Filters in ProcessMind are grouped into these categories:
Each category contains specialized filter types to refine your process analysis.
The Followed By filter lets you analyze the relationship between two activities in a process. You select a start activity and an end activity, then choose how strictly you want to define the connection.
Filter options:
→ Directly Followed By
The end activity must occur immediately after the start activity—no steps in between.
⇄ Indirectly Followed By
The end activity must happen after the start activity, but other steps in between are allowed.
⇋ Not Directly Followed By
The end activity must not happen immediately after the start activity—but it can still occur later.
🚫 Never Followed By
The end activity must never occur at any point after the start activity.
This filter is useful for understanding sequences, exceptions, or confirming if a process step is consistently followed.
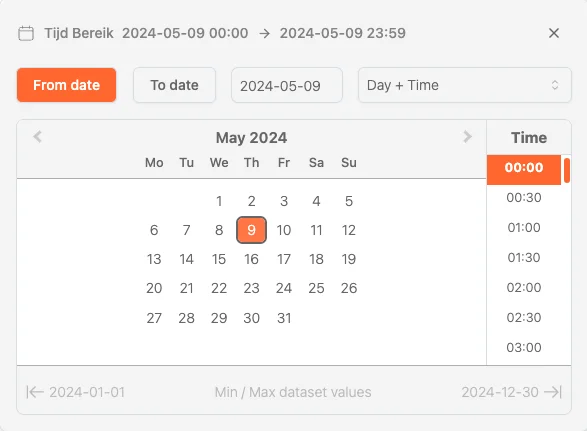
Chart association
If you have a chart with a selected time element, the period filter will automatically be set to the time range of the chart. This allows you to quickly filter the process based on the time range of the chart. If the time binning on the chart is set to automatic the type of filter selected in the period filter will determine the time binning of the chart.
Default attributes represent standard process mining metrics available across all attached datasets. These include:
By using these filters, ProcessMind gives you a flexible way to refine and analyze your process data, helping you focus on what matters most.
info
Filters are always stored locally on your own browser session. In order to store the filters across users use the Bookmark feature. This allows you to share your view, filters and other settings to be shared across your organization and for your team members to access them easily.
We use cookies to enhance your browsing experience, serve personalized content, and analyze our traffic. By clicking "Accept All", you consent to our use of cookies.