

Process Modeling Last updated November 5, 2026
How ProcessMind’s Clarity Engine Keeps Process Maps Readable
See how the Clarity Engine lays out process graphs, what changes in the diagram, and how to compare the result with your own process data.

A process graph can be difficult to investigate when paths overlap or the layout changes between views. The ProcessMind Clarity Engine arranges process diagrams to make the flow easier to read and explore. This page shows what changes in the layout, how it differs from Auto-Layout, and how you can judge the result using your own process data.
What is the Clarity Engine?
The Clarity Engine is ProcessMind’s layout engine for process diagrams. It arranges activities and connections into a process graph you can inspect and work with. It supports process mining models built from event logs, as well as manually created and imported BPMN models.
A layout changes how elements and paths appear on screen, not the underlying process data. A readable diagram can help you follow the process, but it does not make the process itself simpler or prove that the model is correct.
If you have seen a spaghetti diagram and wondered whether process mining can produce something you can actually use, the layout is worth examining. The Clarity Engine is designed to make paths and decision points easier to follow, so you can spend less time untangling the picture and more time investigating what it shows.
Why can the same process log produce an unstable map?


An event log records process events. A process graph turns those events into a visual representation of activities and paths. The layout determines where each element appears and how its connections run.
A graph can be hard to read even when the data is useful. Connections may cross, parallel paths may be difficult to distinguish, and activities may appear in an order that feels unintuitive. If the arrangement shifts after a small change or a new layout run, comparing versions and building a shared understanding of the process can become harder.
That is the problem behind the spaghetti diagram objection. The process may have a clear structure, but the visual arrangement can make it difficult to see.
A consistent layout helps you build a familiar picture of the process. When you return to a graph or compare it with an updated version, you can find activities more easily. Then you can focus on questions such as where work branches, which paths run in parallel, and where the process diverges from the expected route.
I never understood why this industry invested so little in layout. A good model in a bad layout is still unusable, and I would rather read a rough model that is clear than a correct one that is not. Readability is not decoration; it is what decides whether the analysis is ever used.
How does the Clarity Engine arrange a process graph?


The Clarity Engine arranges activities and connections to make the process flow easier to follow. It uses layout choices suited to the graph and, where applicable, available process data. The aim is to give you a clear starting point for investigation, not to promise that every diagram will look identical or need no review.
The layout considers the model’s elements and their relationships. It can use process data to order activities according to how they occur, highlight start nodes, and clarify the flow. When event data is not available, it can still arrange BPMN diagrams based on their structure.
The result is intended to make common features of a process easier to see:
- Main flow: A clear route helps you follow the sequence of work.
- Branches and decisions: Gateways and paths are arranged to make choices easier to identify.
- Parallel activity: Parallel paths can appear side by side, making their relationship easier to inspect.
- Roles and departments: Swimlanes can be ordered to help you see how work is distributed.
- Changes to the model: Incremental layout aims to keep small edits from disrupting the whole diagram.
These are layout goals, not a substitute for checking the model. You know the process context, so review the result and adjust the diagram when the arrangement does not suit how you need to discuss or analyze the work.
The Clarity Engine also aims to align elements to a grid and make connections easier to trace. Those choices can reduce visual clutter, but a complex process may still contain many paths. The goal is to make the structure easier to investigate, not to hide complexity in the data.
What changes in practice when you compare layouts?
The images below compare the same process in a regular dot layout and a Clarity Engine layout. Keeping the process the same makes it easier to judge the effect of layout without confusing it with a change in data.
In the first pair, the Clarity Engine arranges choices and paths for easier reading. In the second, the regular dot layout uses graph structure without the available process data, while the Clarity Engine uses data to help present the flow. The third pair shows parallel paths arranged side by side.


The first comparison shows a change in arrangement, not in the process being compared. The second shows how process data can inform the ordering and presentation of activities. In both pairs, look at whether you can follow the paths and identify the structure you need to investigate.


In the third pair, compare the placement of activities, the routes between them, and how easy it is to distinguish parallel paths. The same process data appears in both layouts, so you can focus on the visual changes. The screenshots have not been retouched to make one layout look better than the other.
How does the Clarity Engine differ from Auto-Layout?
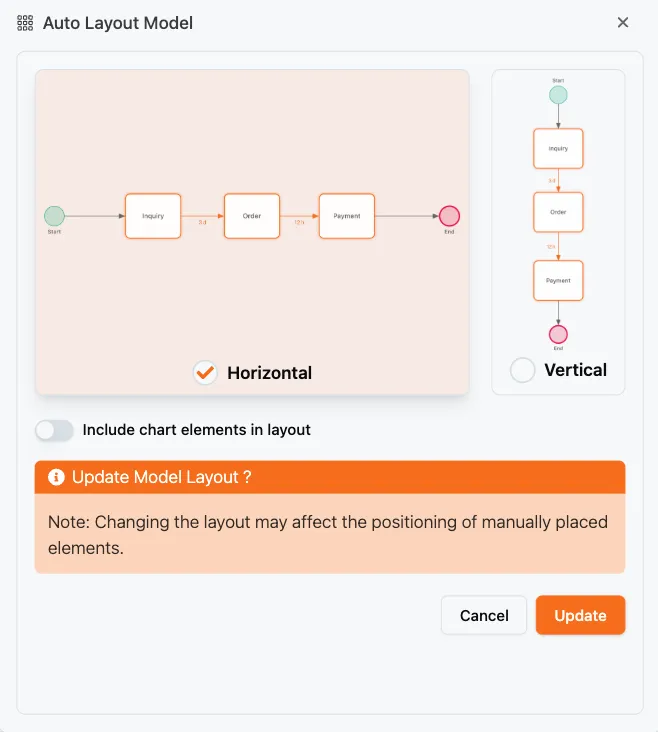
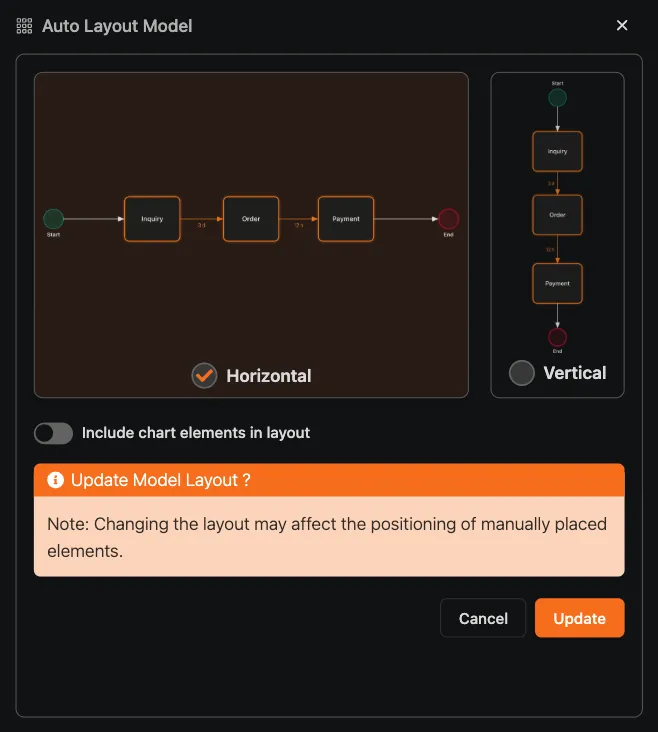
Auto-Layout is the option you select to arrange a model. The Clarity Engine is the layout engine that determines how the diagram is arranged. Put simply, Auto-Layout is the action; the Clarity Engine provides the layout behavior behind the result.
Use Auto-Layout when you want the platform to arrange a model instead of positioning elements manually. The Clarity Engine is relevant to the resulting arrangement, whether the model comes from process mining or BPMN modeling. For the available options and instructions, see the Auto-Layout documentation.
A layout is a starting point, not a verdict on how to represent your process. You can refine the diagram to emphasize a particular route or make it easier for a specific audience to review.
Where does layout quality matter in your workflow?
A readable process graph can help at several stages of your work. It does not replace analysis or review, but it can make the model easier to discuss and investigate.
Discovery
When you first explore a process mined from event data, the graph gives you a visual way to inspect activities and paths. A layout that makes branches and parallel activity easier to see can help you decide where to look next. You still need to validate what the data represents and interpret the process in its business context. For more on investigating a process, read how to analyze your process.
Review
During review, a consistent arrangement makes it easier to refer to the same activities and paths with colleagues. You can discuss a branch, compare routes, and adjust the diagram without having to relearn the whole picture after every small change.
Publication
When you share a process model, the layout affects how quickly someone else can understand it. A clear arrangement can make the process easier to review, but it cannot replace useful labels, accurate documentation, or the context your audience needs.
If you are comparing a process map with a diagramming tool you already use, consider both the modeling workflow and the process data behind the model. Compare it with what you have today.
Compare layouts on your own process
Load a process log and see how the Clarity Engine arranges your process graph. Judge the result against the layout you use today.
What should you check when you evaluate a layout?
A diagram can look tidy and still be hard to investigate. Use these practical checks when you compare layouts:
- Can you follow the main route without losing track of the connections?
- Are branches and decision points easy to distinguish?
- Can you tell which activities happen in parallel?
- Does the arrangement remain familiar after a small model change?
- Can you adjust the diagram to suit the people who need to review it?
Focus on what you need to do with the diagram. A layout is useful when it helps you answer questions about the process, not simply when it looks orderly.
The Clarity Engine aims to provide a consistent starting arrangement and keep small changes from disrupting the whole diagram. It also supports manual refinement, because you know the process context and may need to present the same model in different ways.
How do you get started?
The clearest test is to compare layouts using your own process data. Load a log, inspect the resulting process graph, and check whether the arrangement helps you follow the paths and investigate your questions.
If you already have a model, try arranging it and review the result against the criteria above. If you are starting with an event log, first make sure it contains the event data needed to represent your process. Then assess the diagram as a visual aid to analysis, not as a replacement for validating the data or understanding the work.
The Clarity Engine does not promise that every process will fit into a simple diagram. It gives you another way to make a process graph’s structure easier to read and investigate. To see whether that helps with your work, start a free trial.