Process Dashboards and KPIs
Track key performance indicators (KPIs) in real time, break down cycle times, and detect bottlenecks with AI. Use process dashboards with advanced filters, sustainability metrics, and dataset comparison.
No credit card required · Real-time process dashboards · Free trial included
Features in Depth
Data-Driven Process Analysis and Insights
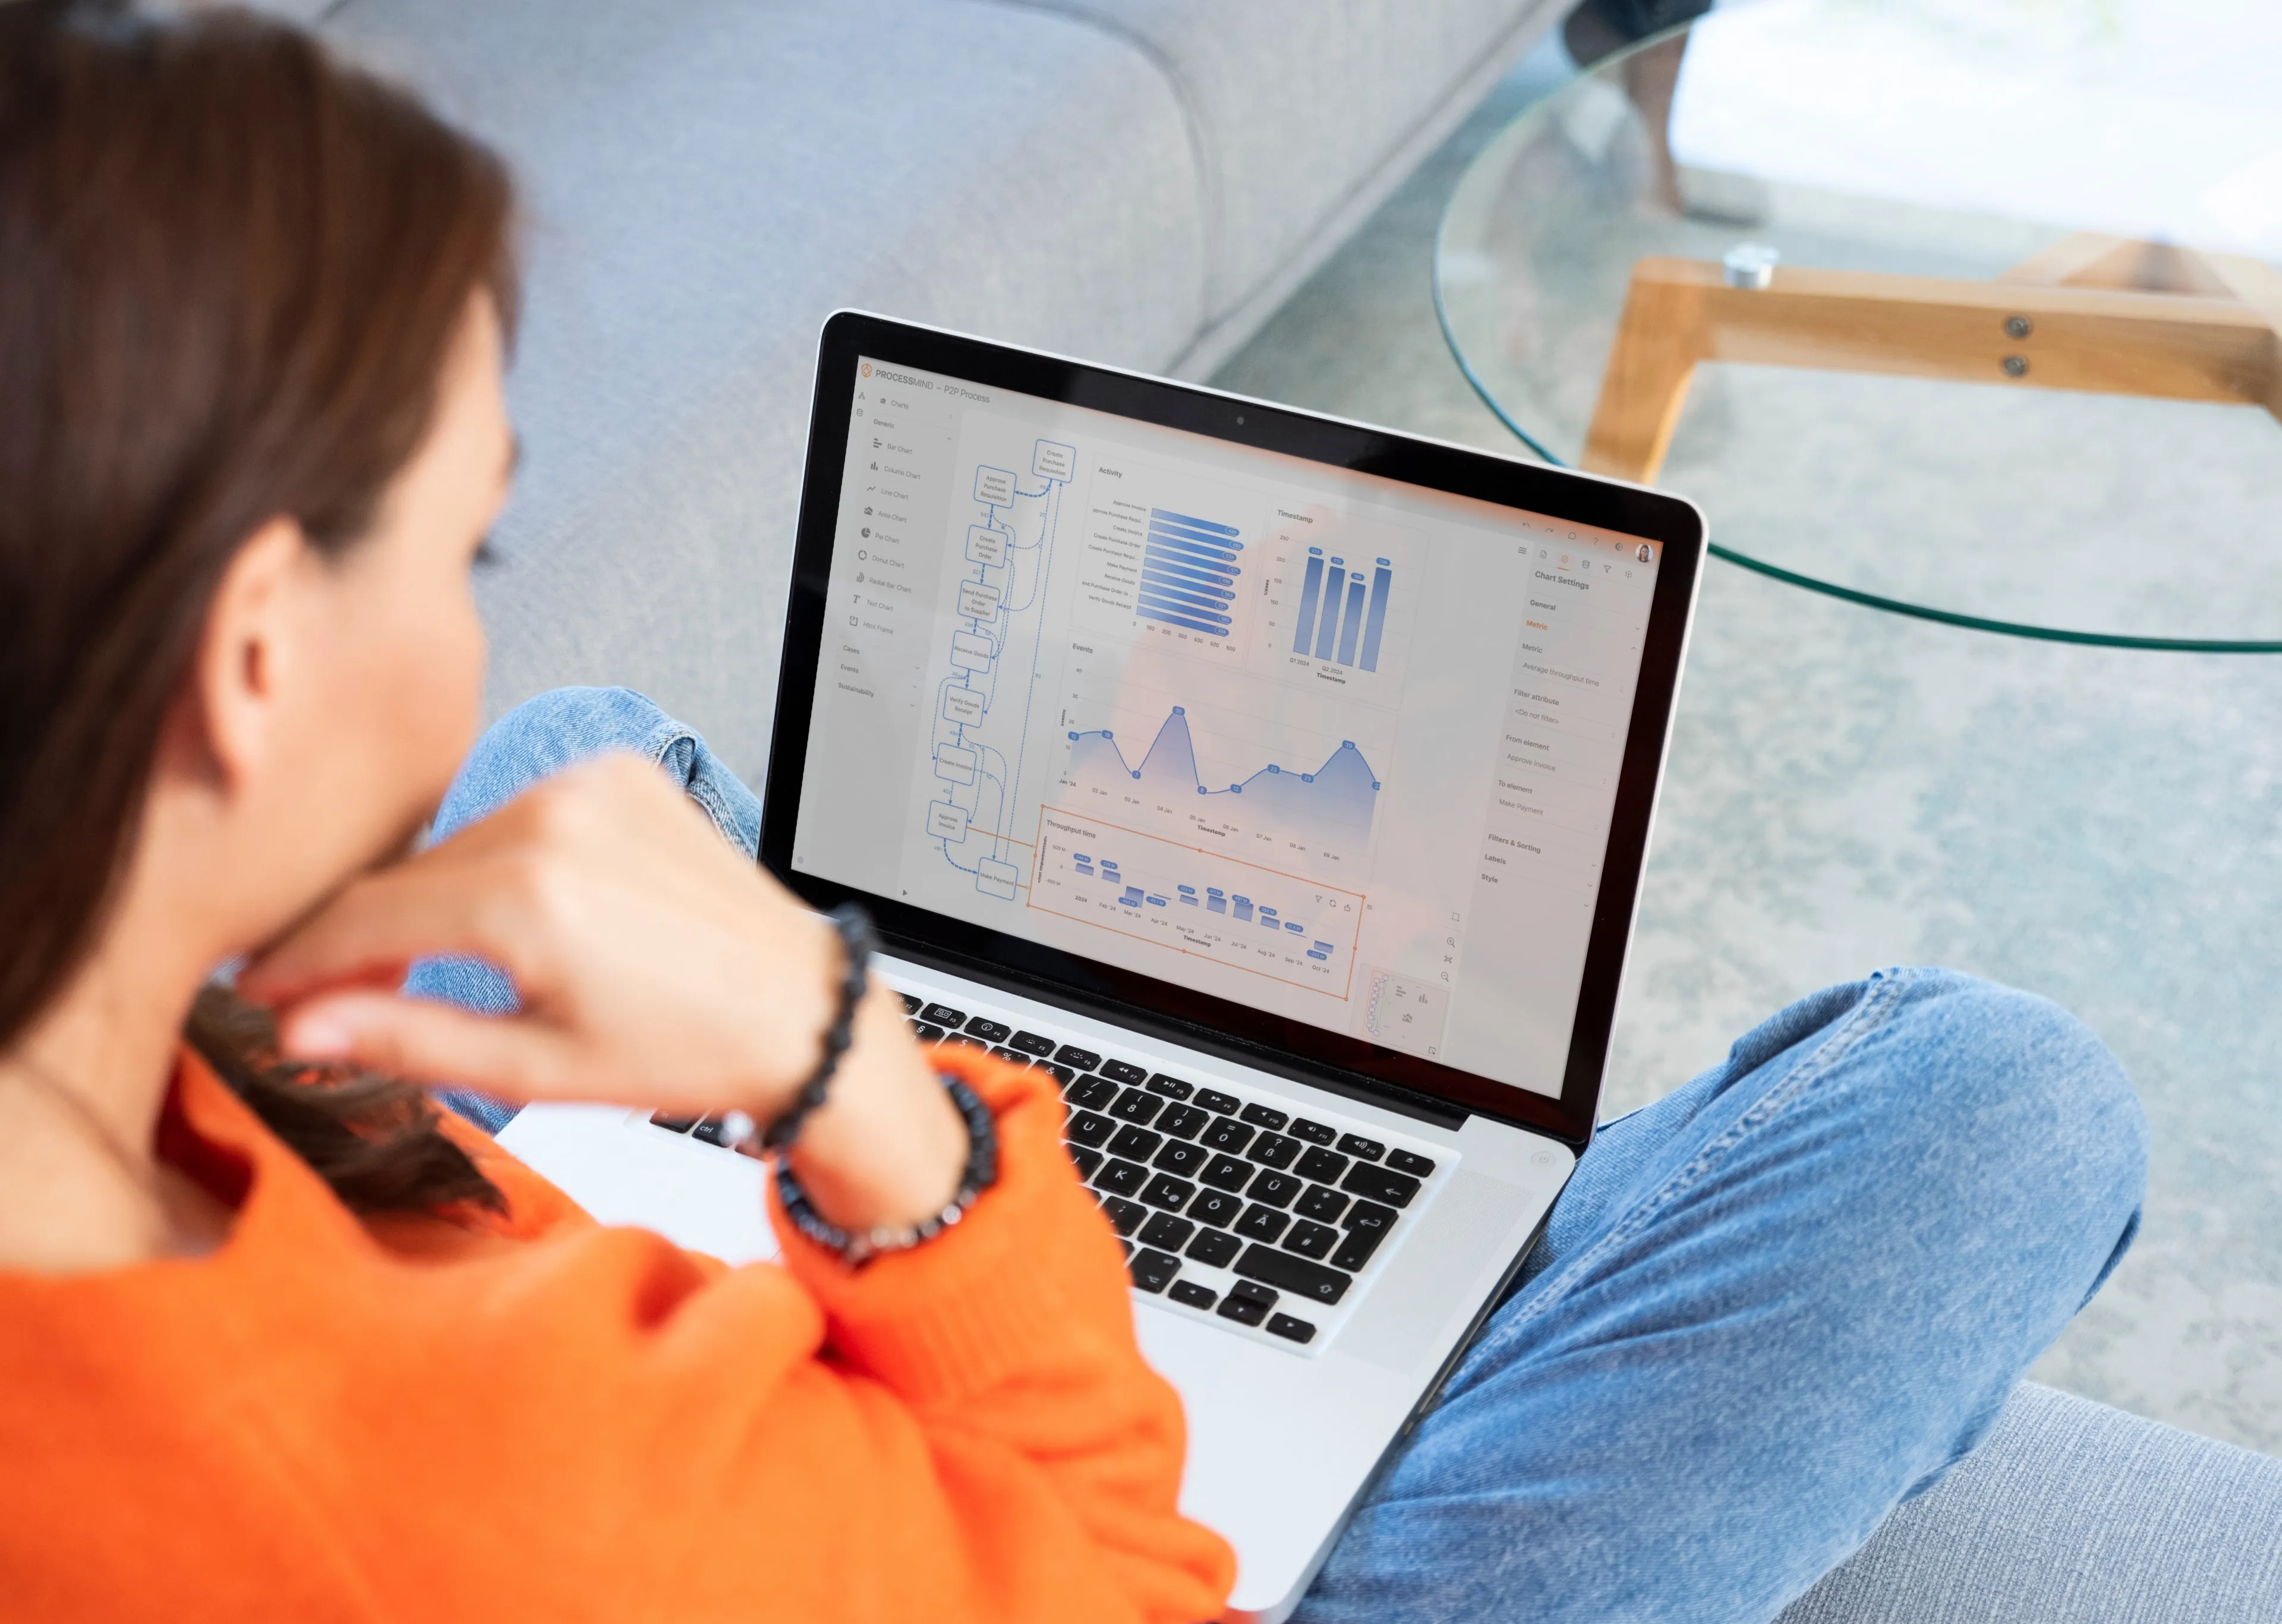
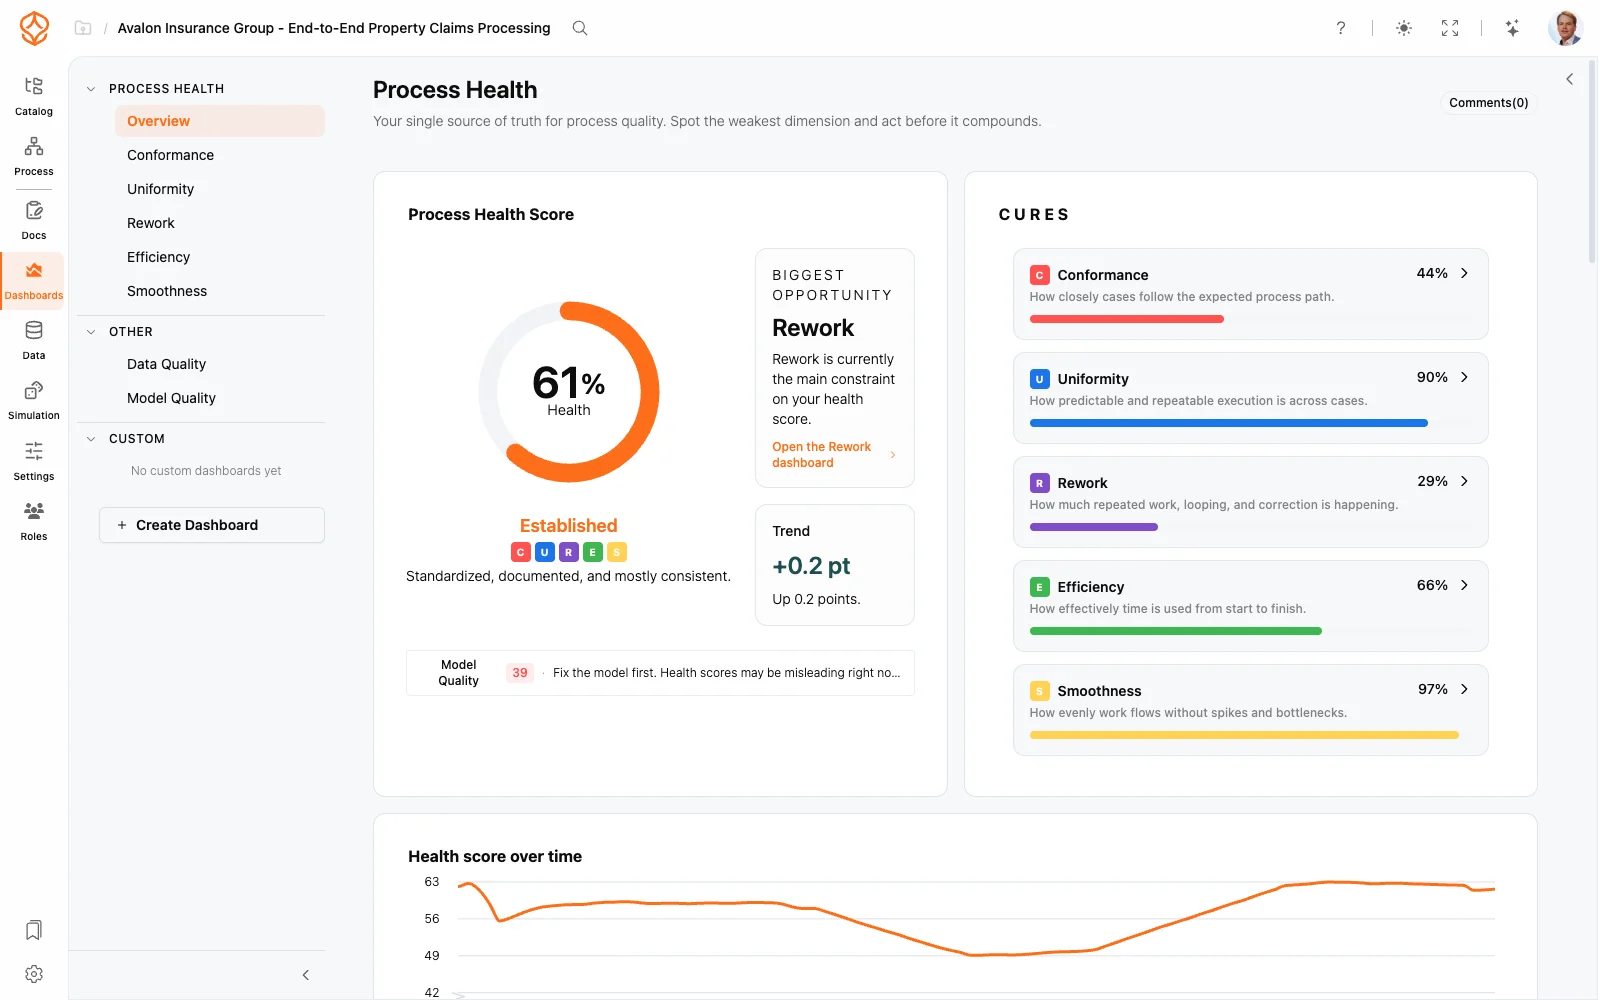
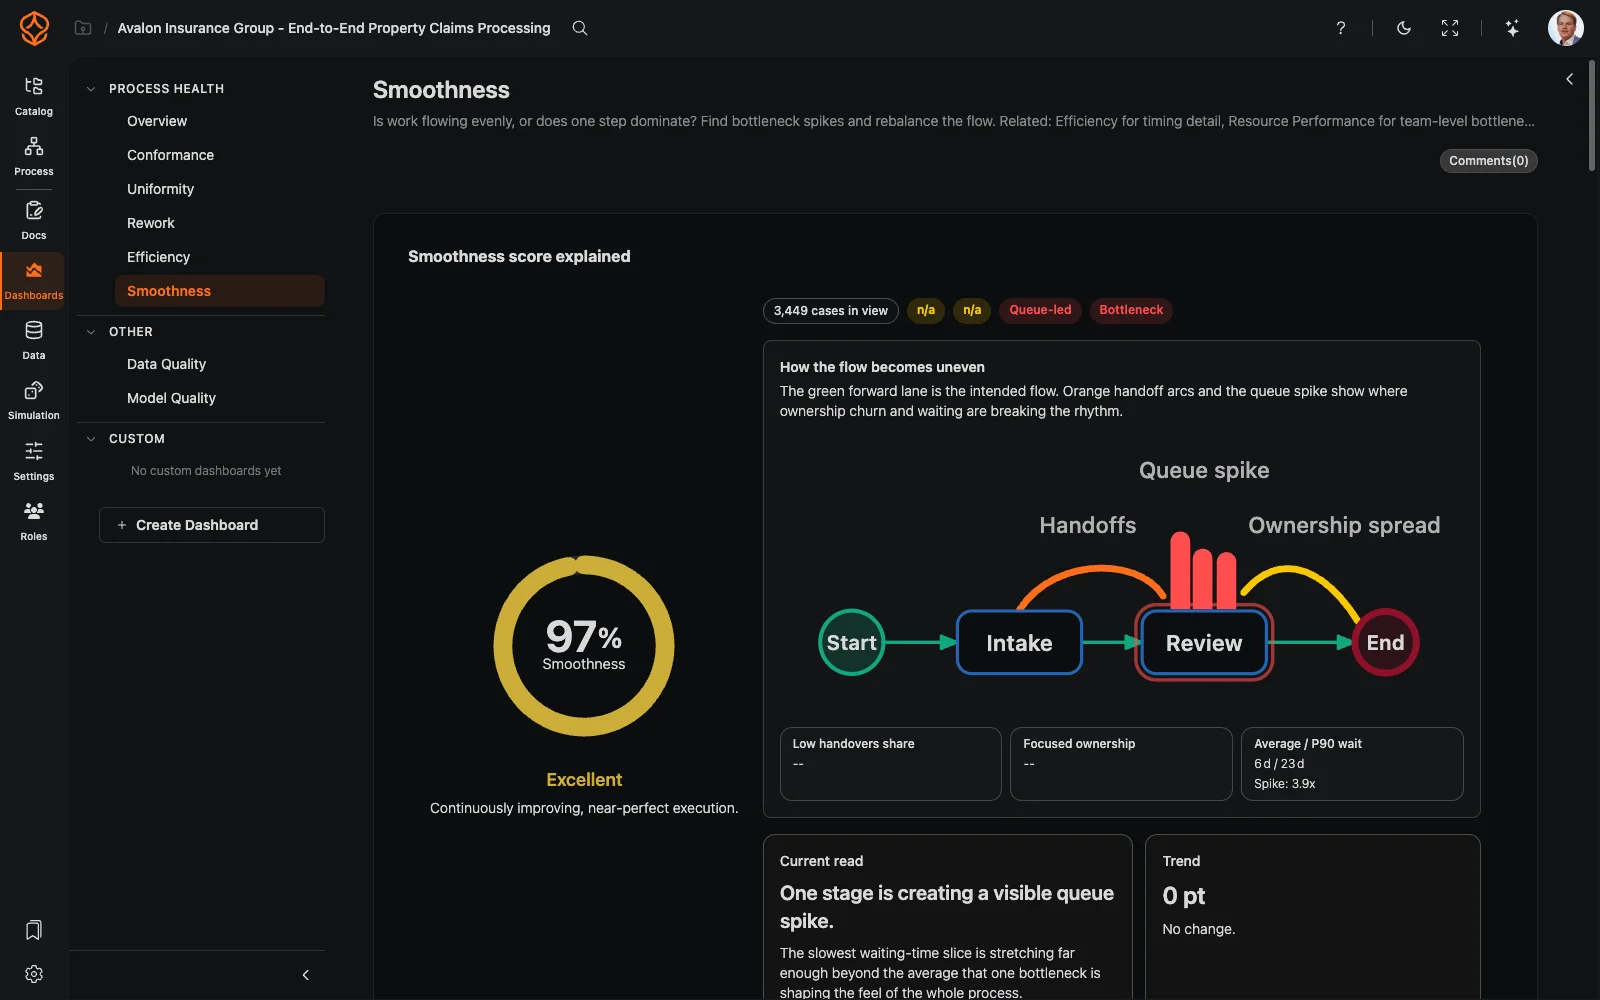
Customizable Dashboards
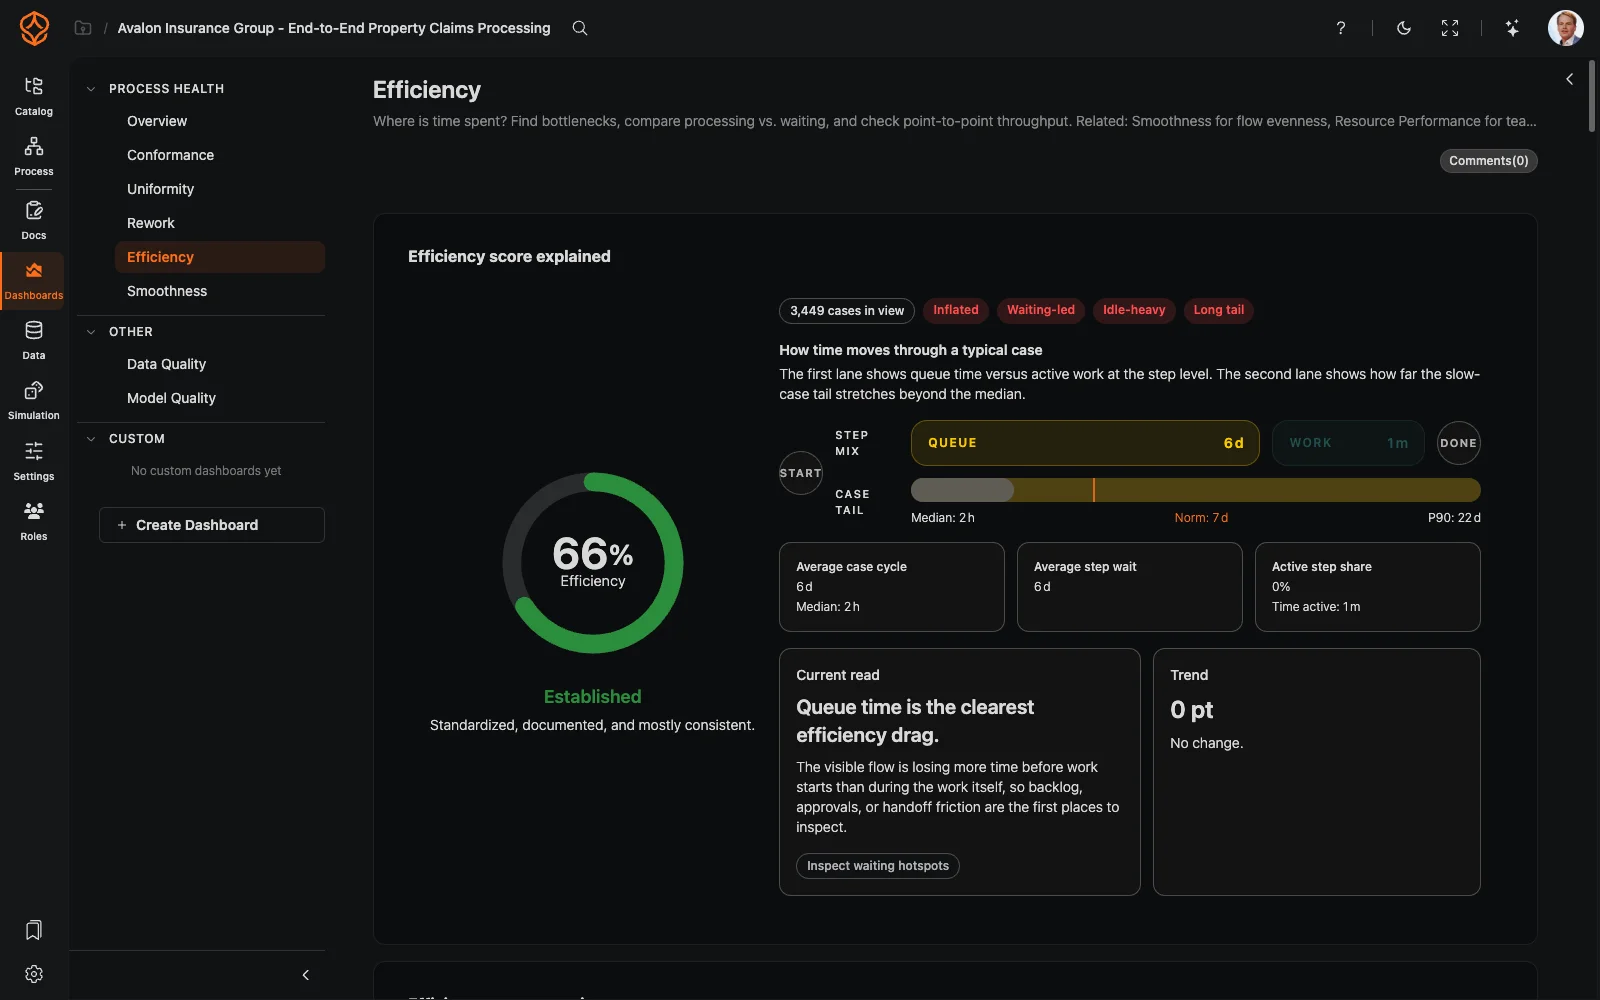
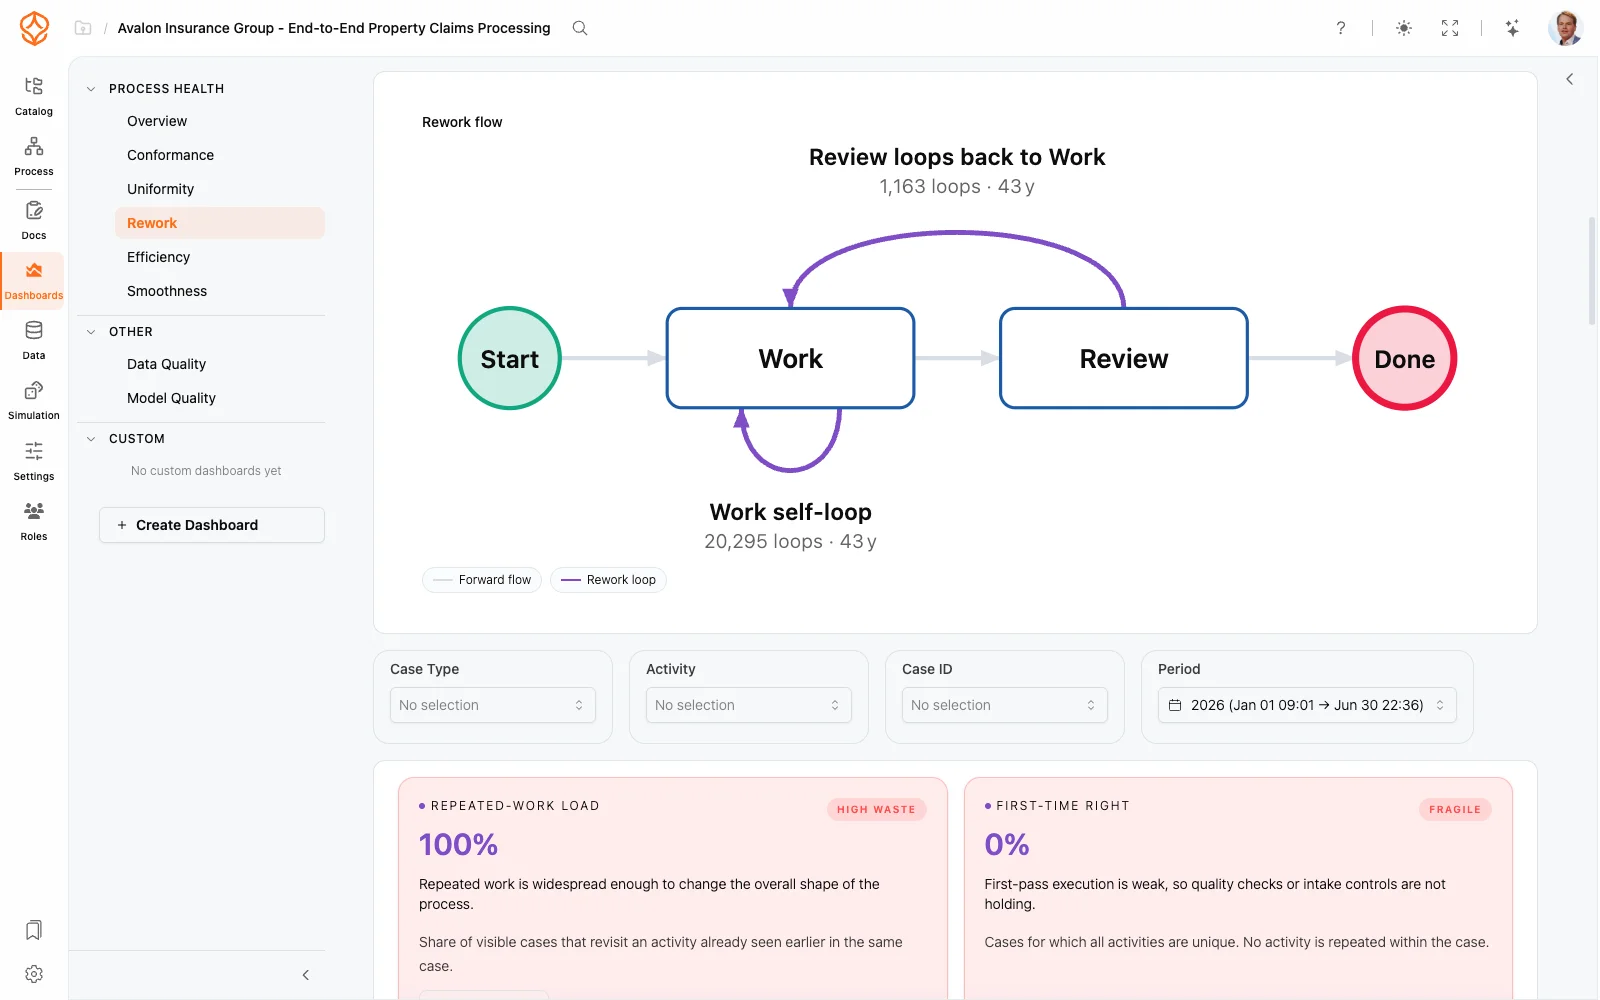
Build the process dashboards you need to monitor and improve your processes.
- Pre-built KPI widgets for cycle time, throughput, and cost.
- Custom views for each process, department, or time period.
- Drill down from any chart to the individual cases behind it.
- Copy any pre-built dashboard into your own space and tailor its groups, rows, and tiles.
- Carbon footprint tracking (tCO2e) for environmental impact monitoring.
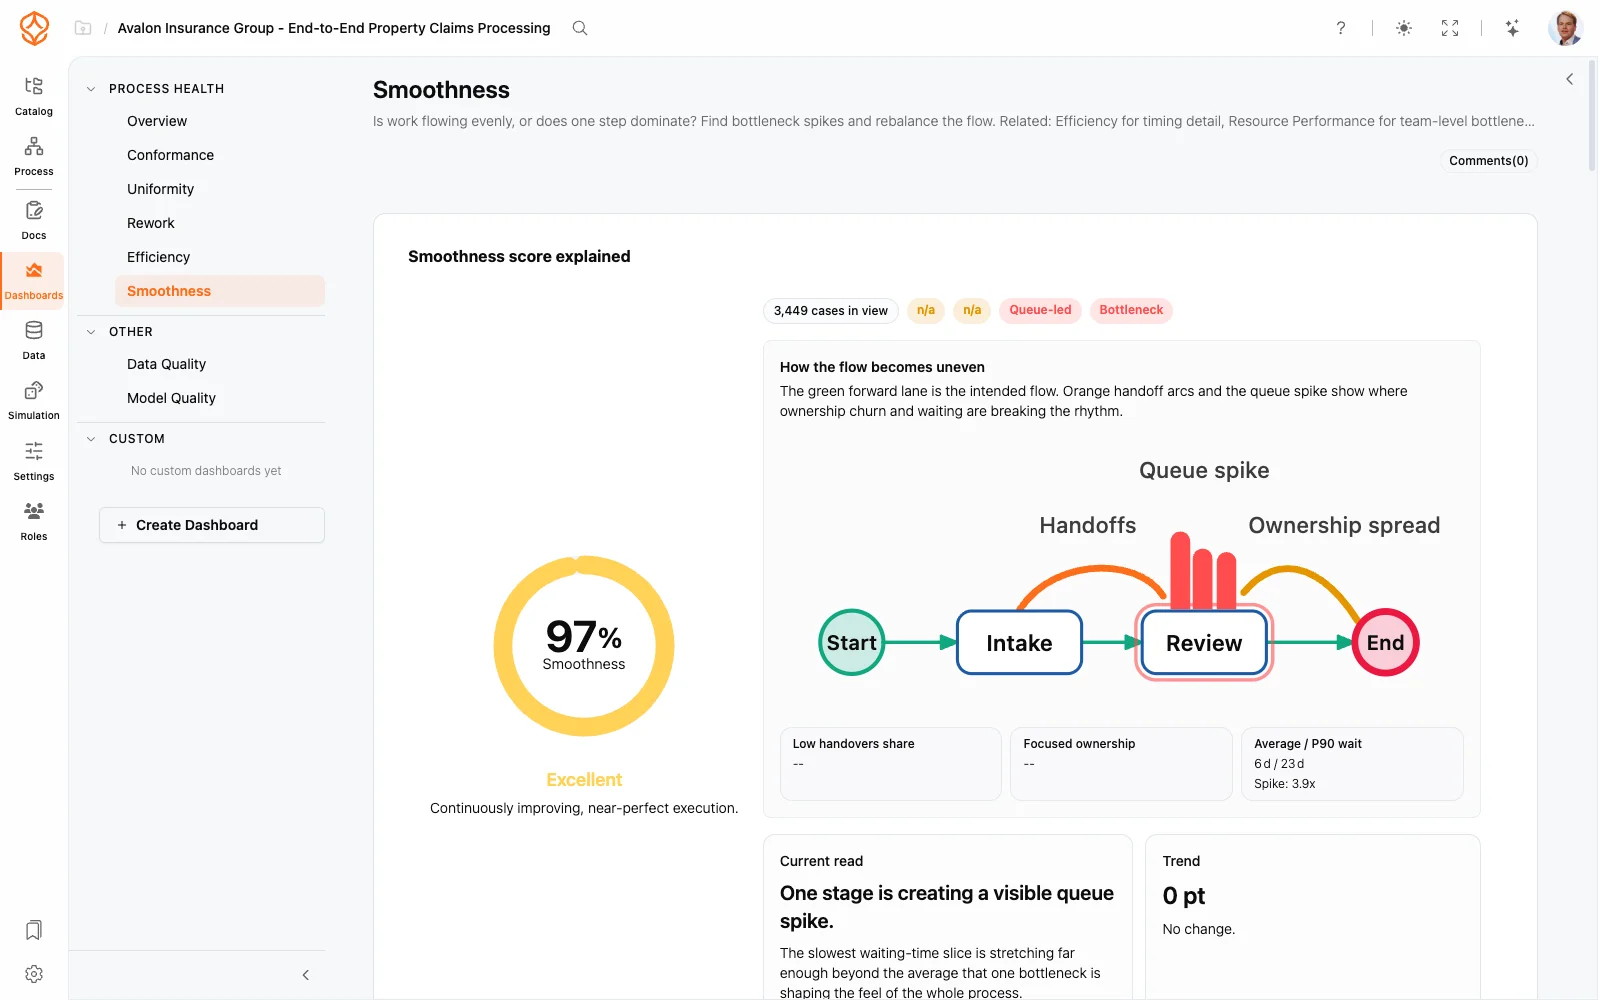
- Norms and benchmarks to measure performance against your target process KPIs.
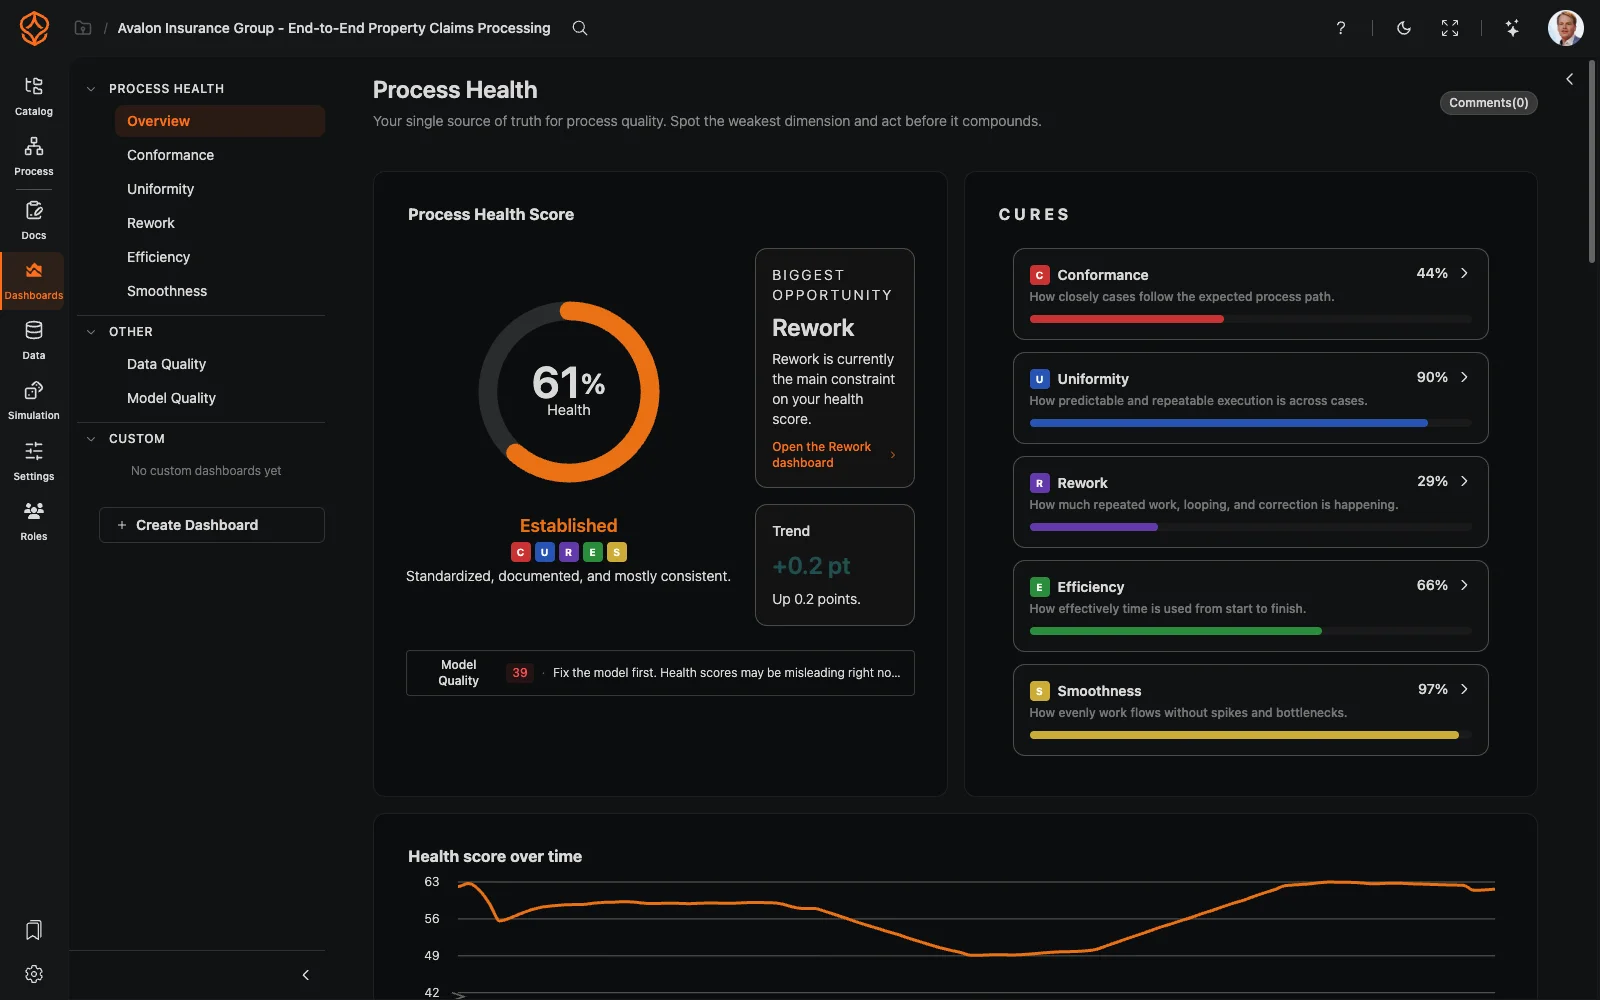
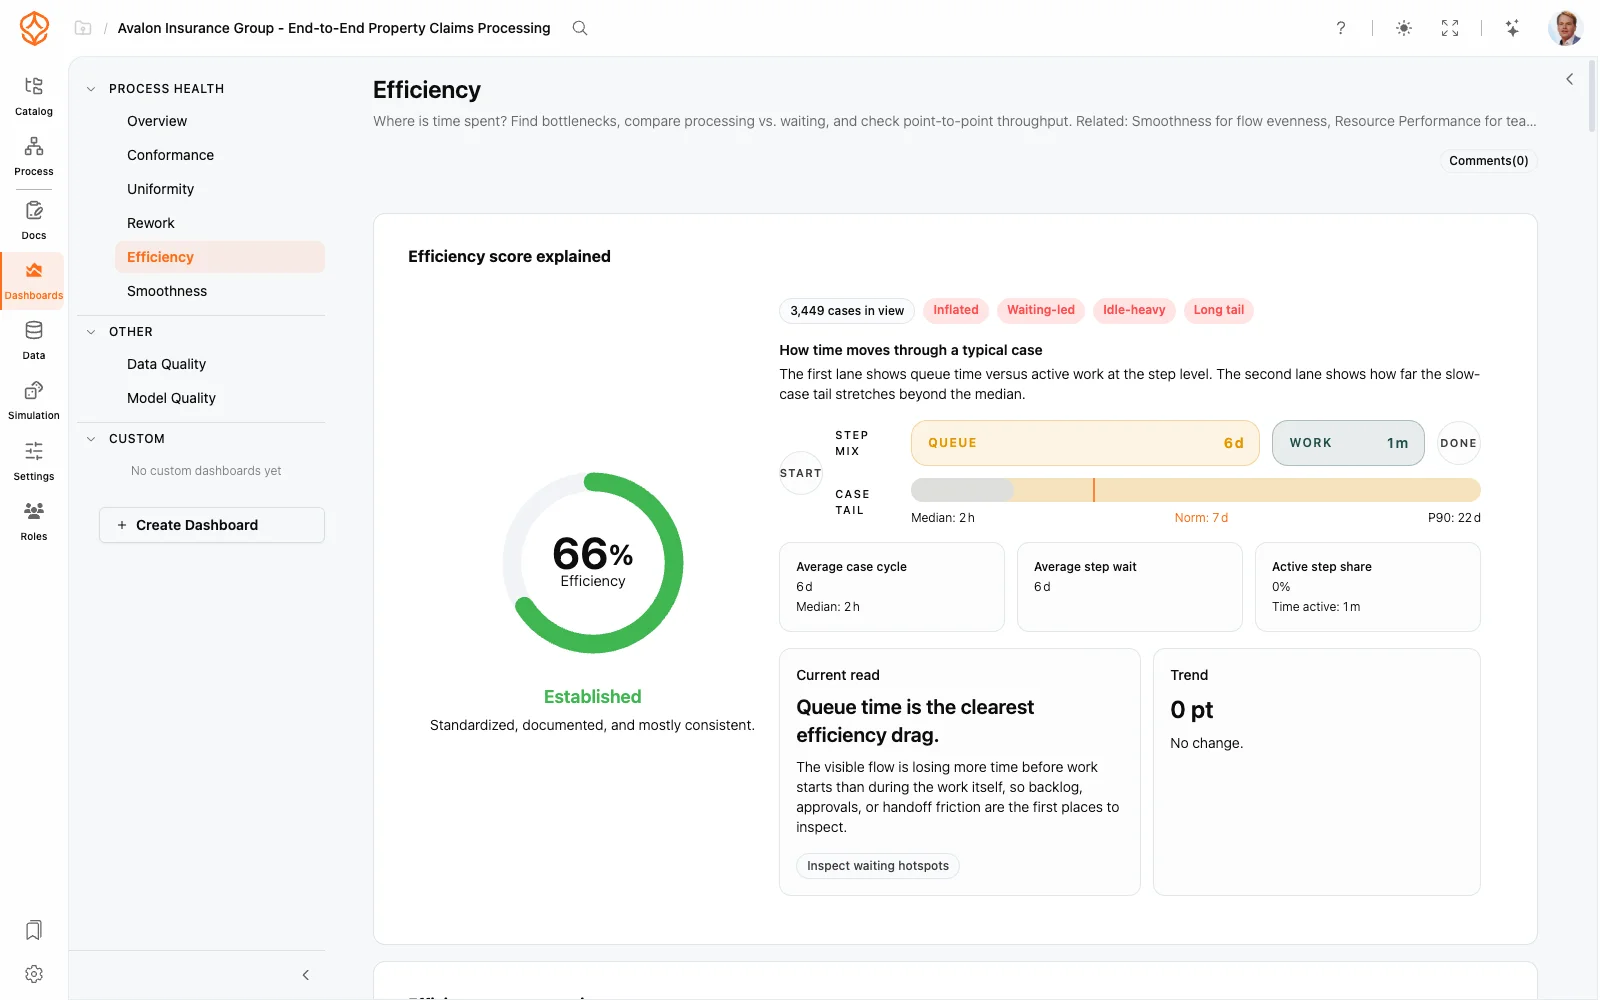
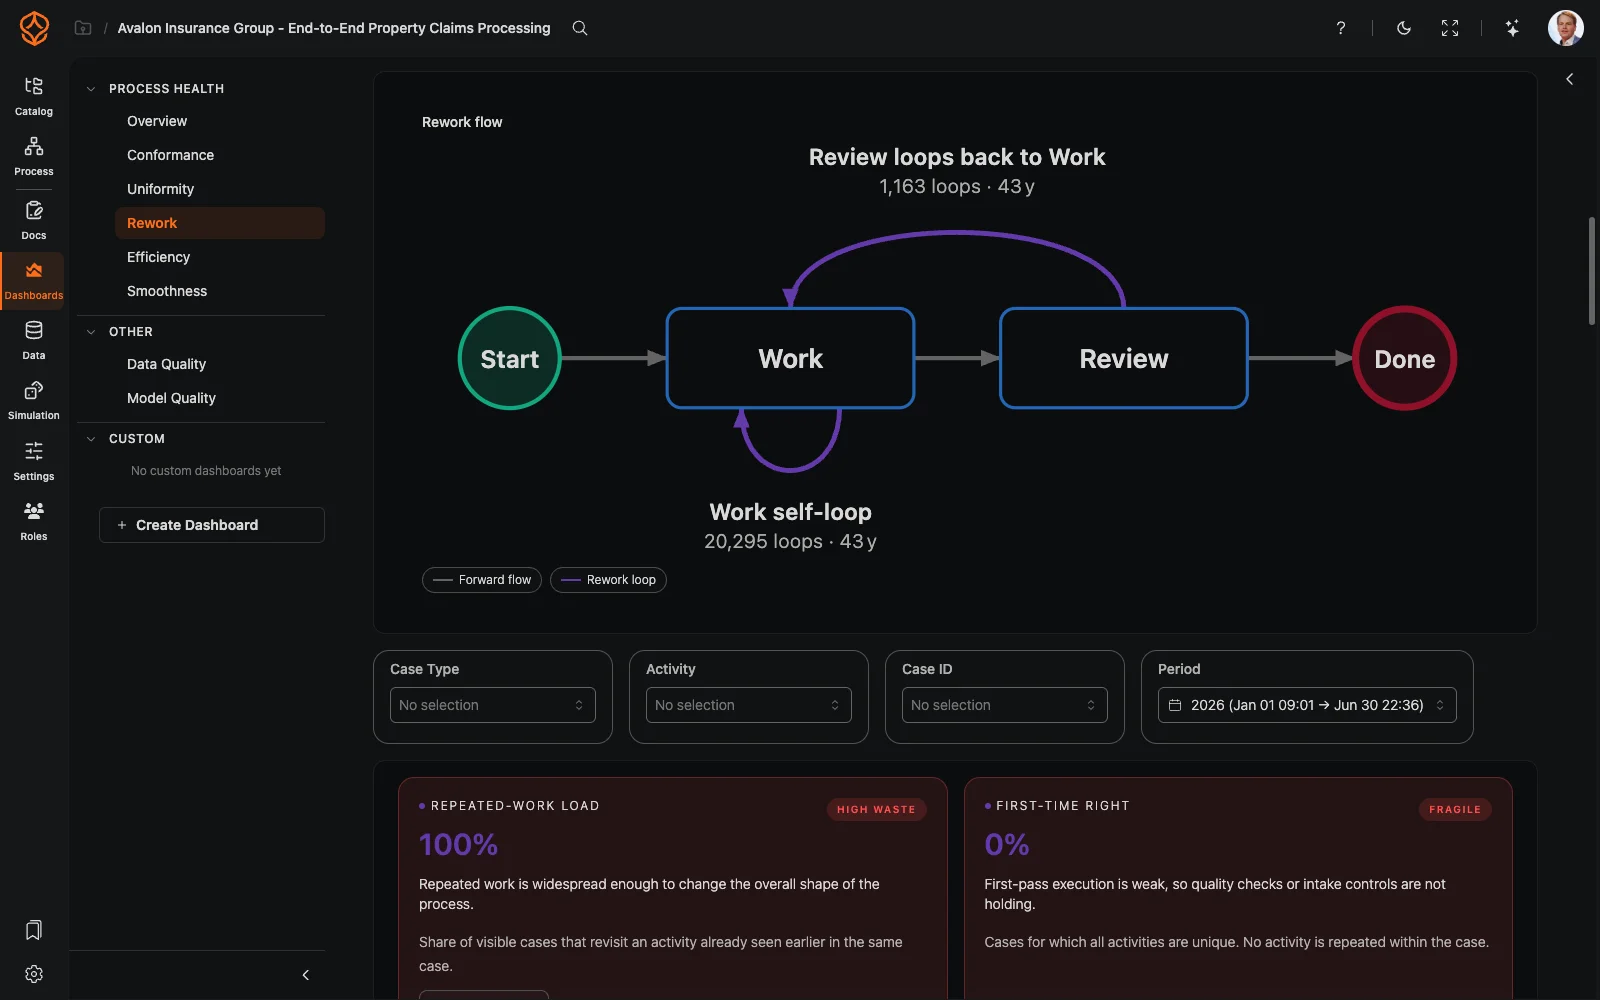
- Pre-built Process Health dashboards with views by dimension, including conformance and rework, plus model-quality scores.
- Dataset comparison: overlay the current period with the previous period or compare real and simulated data.
- Export dashboards and charts as PNG or SVG, or copy them as images.
- Share dashboards with your team for collaborative process analysis.
Advanced Filtering and Analysis
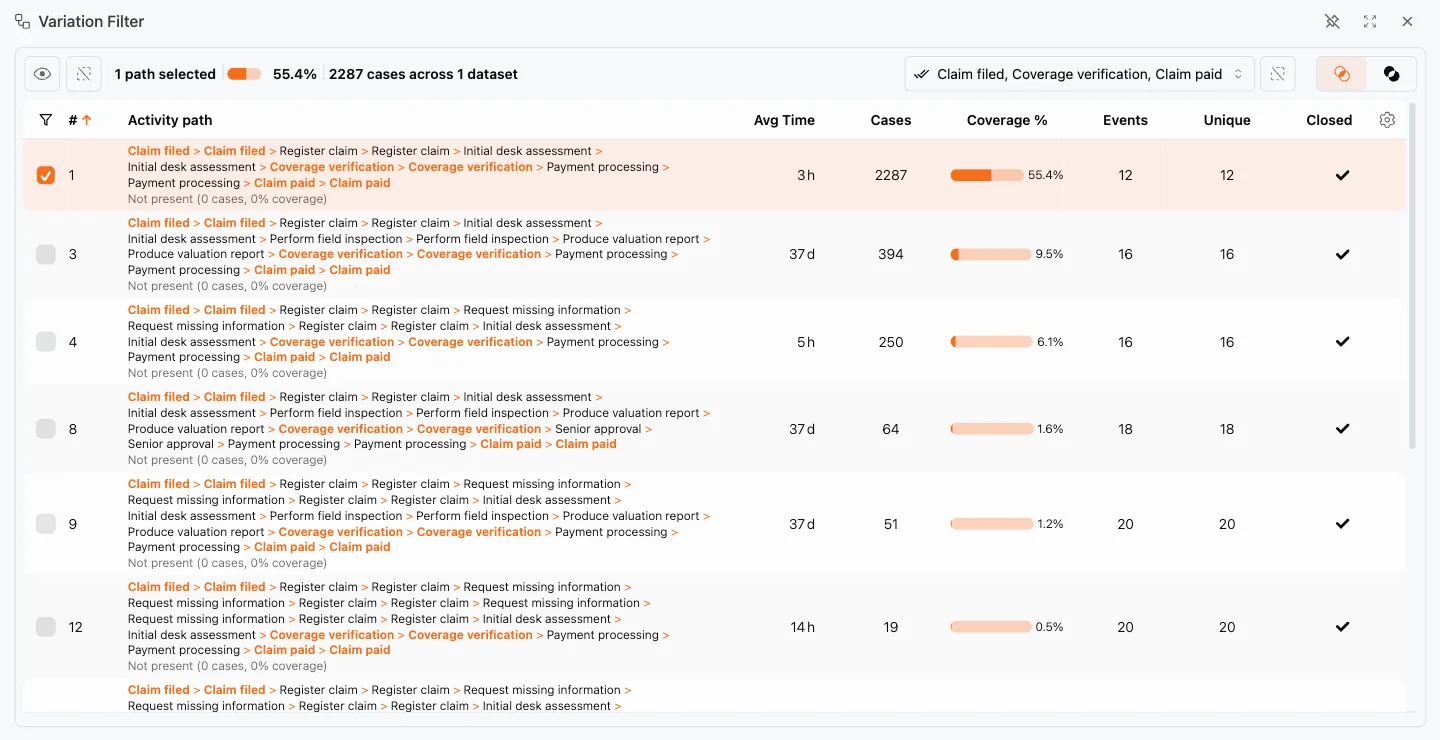
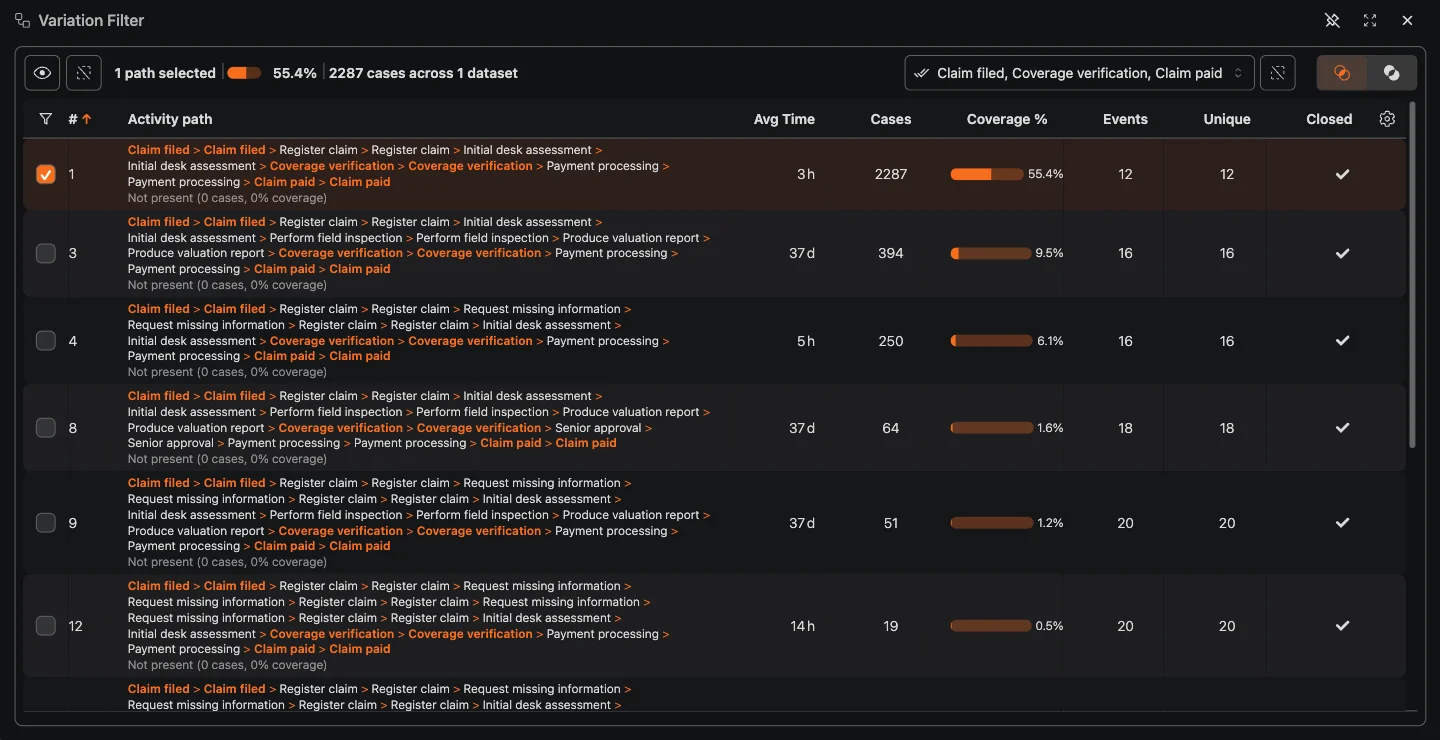
Slice and analyze your process data with powerful filtering capabilities.
- Filter by activity, case, time period, or resource.
- Create case tags and filter by them to focus on specific cases, regions, or priorities.
- Compare process variants side by side.
- Use root cause analysis to understand why cases deviate.
- Use path analysis to identify the most common and costly routes.
Process Intelligence
Key Features
All Analytics Features
What's Next
From Process Analysis to Process Optimization
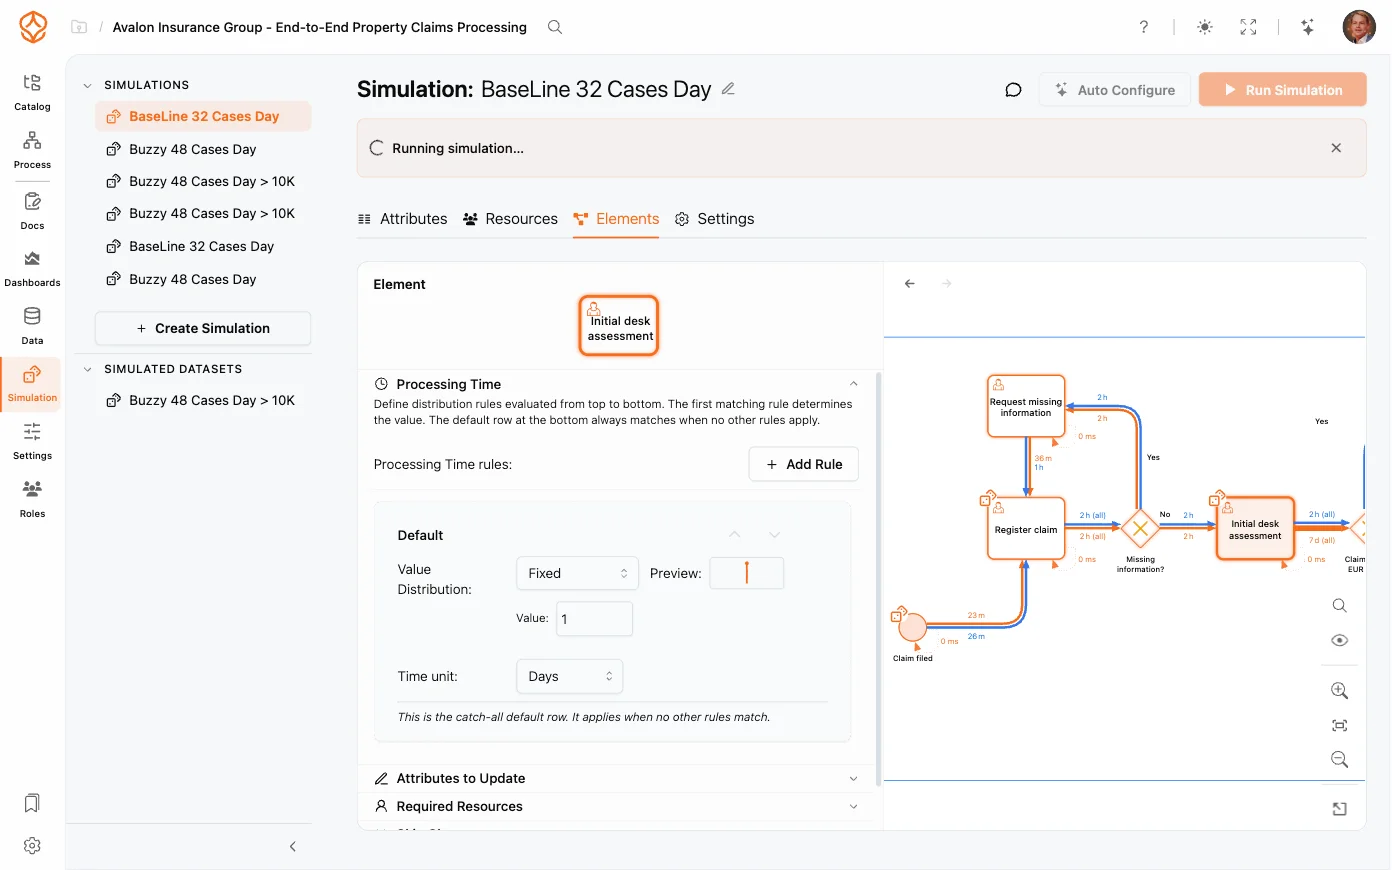
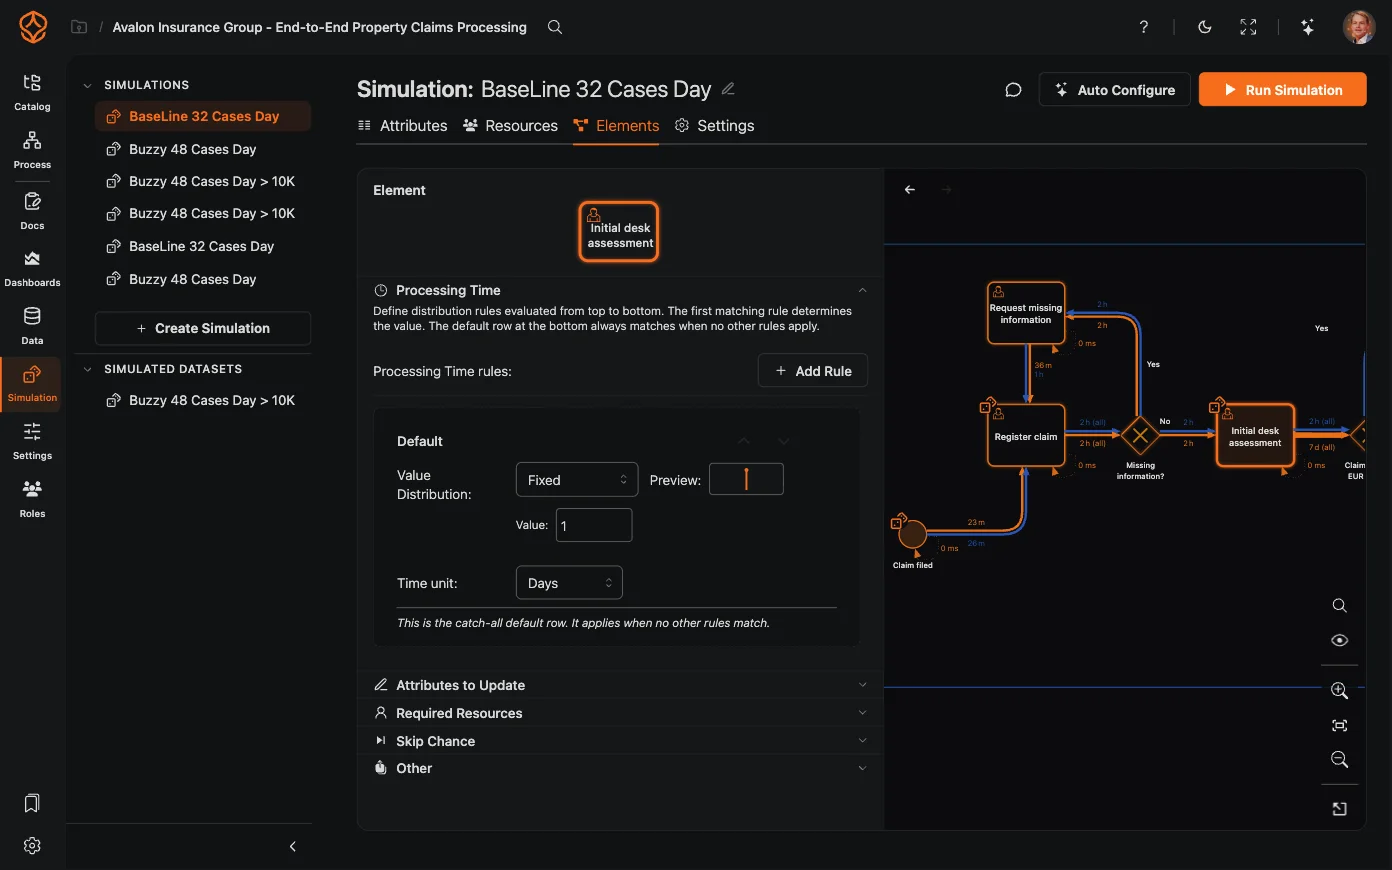
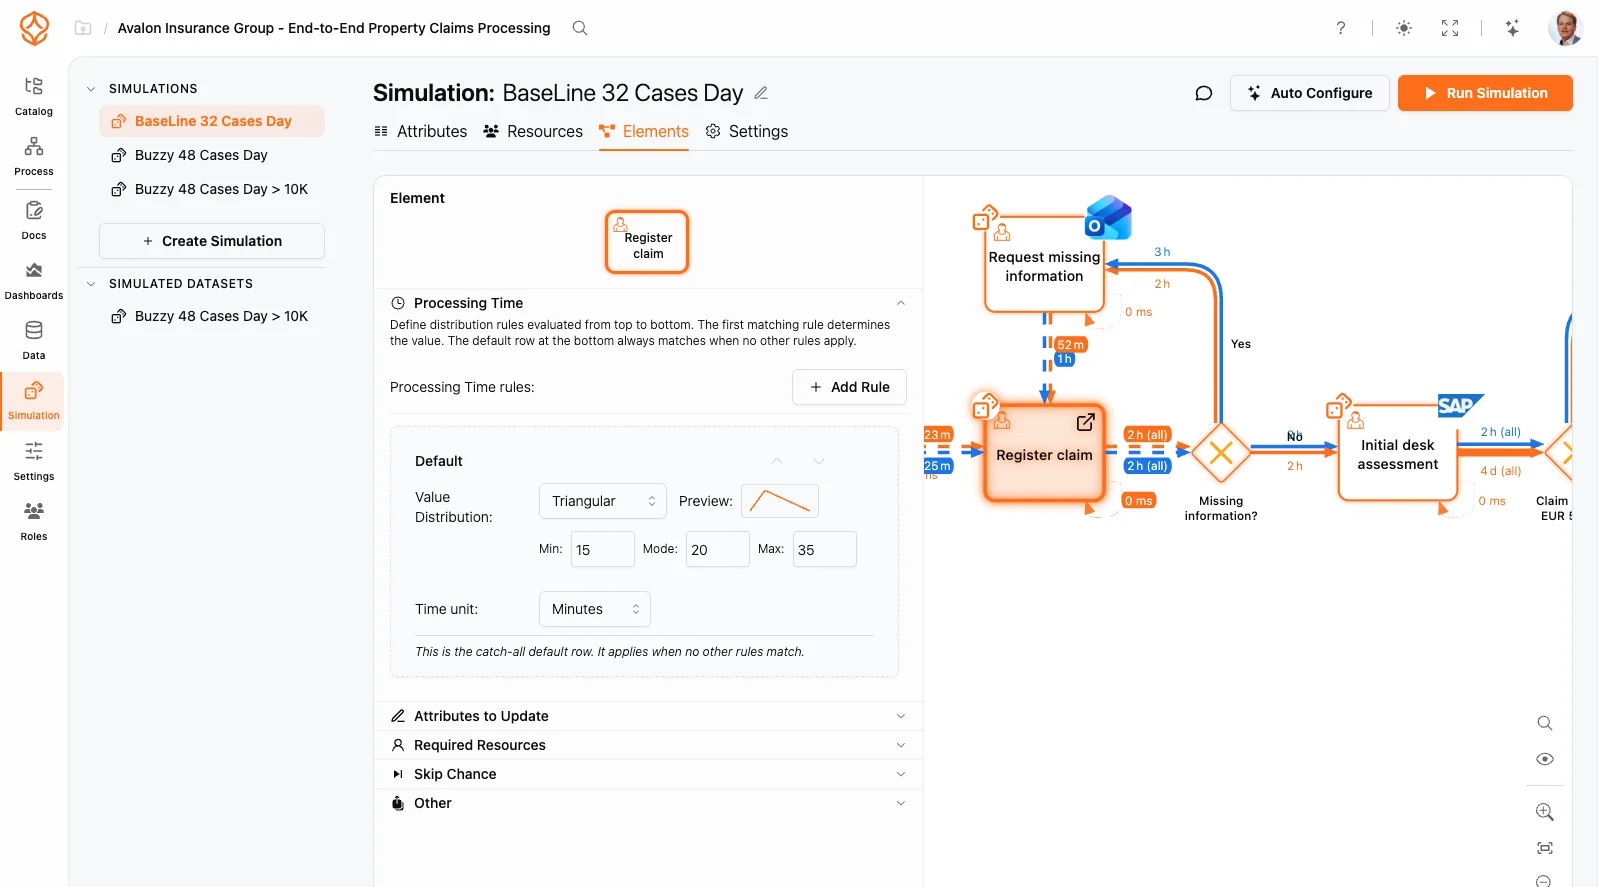
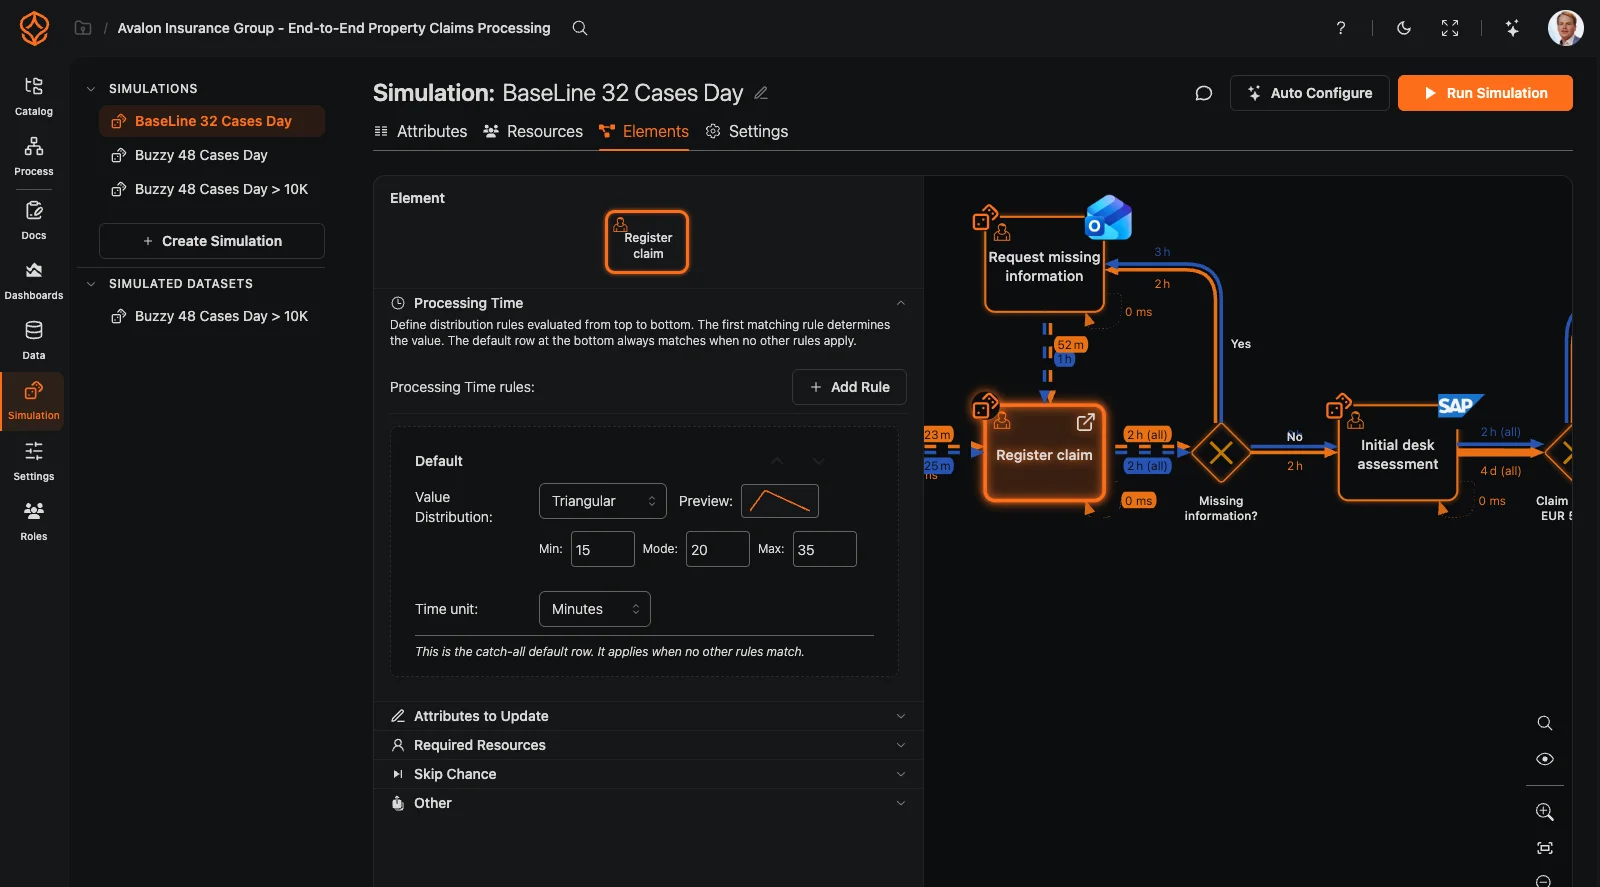
Simulate Improvements
Once you've identified bottlenecks and inefficiencies in your process dashboards, take the next step.
- Run what-if simulation scenarios based on your real process data.
- Model cost changes, resource additions, or process redesigns.
- Compare the simulated outcome with your current baseline.
- Make data-driven business decisions with confidence.
Maturity Stage
Where Do Dashboards Fit?
Process Foundation
Model and document your processes to create clarity and shared understanding.
Process Architecture
Define and manage your process landscape to align operations with strategy and compliance.
Process Intelligence
Use data and AI to understand, predict, and continuously improve performance.
Turn Your Process Data Into Action
Create real-time dashboards from your event logs in under 2 minutes. Spot bottlenecks before they cost you. Start your free trial today.